Which Areas of the UK are the Most Entrepreneurial (and Most Successful)?
Table of Contents
- Top 50 Most Entrepreneurial Local Areas in the UK
- Which regions are most entrepreneurial?
- Region by region breakdown
In 2019, there were 2,696,580 small businesses registered for VAT and/or PAYE in the UK. Small businesses have up to 49 employees, and those registered for VAT and/or PAYE have arguably achieved a certain level of success because they've hit certain turnover and employment milestones. That is, businesses register for VAT once their turnover surpasses £85,000 a year and register for PAYE once they start employing staff (and paying them at least £120 a week).
But where are these companies scattered around the UK, and which areas have the highest concentration of businesses? To find out, we calculated the number of small businesses per 10,000 working-age people in each local authority and region. Learn more about our calculations and assumptions in the Methodology section below, or find how your parliamentary constituency compares in the data table where areas are listed alphabetically.
Top 50 Most Entrepreneurial Local Areas in the UK
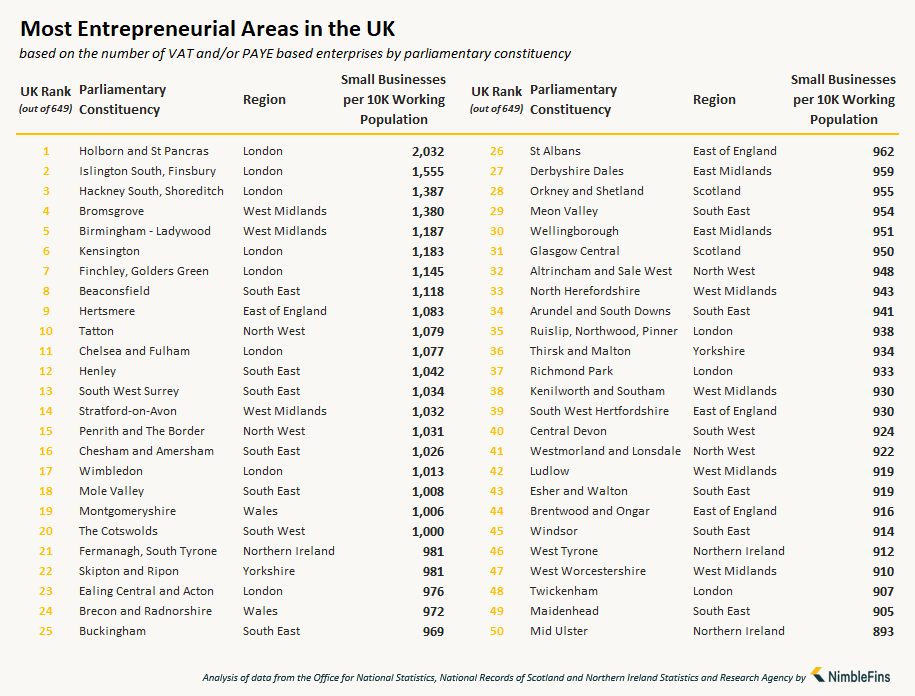
Three local parliamentary constituencies in London topped the charts for having the highest number of small businesses per person in the UK: Holborn & St Pancras, Islington South & Finsbury, and Hackney South & Shoreditch.
Holborn & St Pancras had a whopping 2,032 small businesses for every 10,000 working-age people—that's essentially 1 small business for every 5 people. In fact, the rate in Holborn & St Pancras is 3.5X the UK average of 588 small businesses per 10K working population.
The rest of the top 50, while dominated by London and the South East, has representation by all regions of the UK except the North East.
Most Entrepreneurial Regions in the UK
Not surprisingly, London tops the charts as the region with the highest number of small businesses per person. The capital sported 521,160 small businesses in 2019, giving it a figure of 808 small businesses per 10,000 working-age people—37% higher than the UK average of 588.
However other regions are not that far behind London. Outside of the capital, the next most entrepreneurial region is the South East, with 410,735 small businesses and a rate of 663 small businesses per 10,000 working-age people. Third overall is the East of England, with 266,400 small businesses and a rate of 637 small businesses per 10,000 working-age people.
The region with the lowest concentration of small businesses is the North East, where 69,830 enterprises over 1,838,102 working people yields a rate of just 380 small businesses per 10,000 population—35% less than the UK average.
Most Entrepreneurial Regions in the UK
| Rank | UK Region | Number of Small Businesses (0-49 employees) | Working Population (aged 16 to 70) | Small Businesses per 10,000 Working Population |
|---|---|---|---|---|
| 1 | London | 521,160 | 6,446,799 | 808 |
| 2 | South East | 410,735 | 6,190,834 | 663 |
| 3 | East of England | 266,400 | 4,180,064 | 637 |
| 4 | South West | 231,885 | 3,768,264 | 615 |
| 5 | Northern Ireland | 73,775 | 1,295,774 | 569 |
| 6 | East Midlands | 180,310 | 3,304,829 | 546 |
| 7 | West Midlands | 217,535 | 4,025,170 | 540 |
| 8 | North West | 261,565 | 5,019,586 | 521 |
| 9 | Yorkshire and the Humber | 185,205 | 3,764,248 | 492 |
| 10 | Wales | 104,060 | 2,142,500 | 486 |
| 11 | Scotland | 174,120 | 3,852,894 | 452 |
| 12 | North East | 69,830 | 1,838,102 | 380 |
| UK average | 2,696,580 | 45,829,064 | 588 | |
How concentrated are small business activities within each region—that is, does entrepreneurship all happen in one small area? London and the South East both had 11 local areas feature in the top 50, followed by the West Midlands with 7. These figures give an indication of how widespread entrepreneurship is in a region—that is, how concentrated small businesses activities are in each region.
| Region | Number of Local Authorities in the top 50 |
|---|---|
| London | 11 |
| South East | 11 |
| West Midlands | 7 |
| East of England | 4 |
| North West | 4 |
| Northern Ireland | 3 |
| Wales | 2 |
| South West | 2 |
| Yorkshire and the Humber | 2 |
| East Midlands | 2 |
| Scotland | 2 |
| North East | 0 |
Entrepreneurship by UK Region
Next, let's dig deeper into the data for each region of the UK. Which local areas have the highest proportions of small businesses in each region? Here's what we found.
Most Entrepreneurial Areas in the East Midlands
Derbyshire Dales and Wellingborough have the most small businesses given the local populations in the East Midlands, each with more than 900 small businesses per 10,000 working-age people—around 75% higher than the average of 546 small businesses per 10,000 working-age people in the East Midlands. These two areas also both rank in the Top 50 parliamentary constituencies in the entire UK. Out of the 46 parliamentary constituencies in the East Midlands, Nottingham North is the least entrepreneurial, with just 253 small businesses per 10,000 working-age people (1,670 small businesses for 66,066 population).

| East Midlands Rank | UK Rank | Local Authority | Number Small Businesses (0-49 employees) | Working Population (aged 16 to 70) | Small Businesses per 10,000 Working Population |
|---|---|---|---|---|---|
| 1 | 27 | Derbyshire Dales | 5,180 | 54,008 | 959 |
| 2 | 30 | Wellingborough | 7,235 | 76,054 | 951 |
| 3 | 78 | South Northamptonshire | 6,485 | 81,097 | 800 |
| 4 | 85 | Daventry | 5,485 | 69,391 | 790 |
| 5 | 108 | Rutland and Melton | 5,315 | 69,995 | 759 |
| 6 | 147 | Newark | 4,950 | 70,483 | 702 |
| 7 | 155 | South Leicestershire | 5,055 | 73,087 | 692 |
| 8 | 177 | Harborough | 4,790 | 71,102 | 674 |
| 9 | 204 | Rushcliffe | 4,420 | 68,165 | 648 |
| 10 | 217 | Northampton North | 3,735 | 58,578 | 638 |
| 11 | 219 | South Holland and The Deepings | 4,560 | 71,755 | 635 |
| 12 | 220 | Bosworth | 4,565 | 71,853 | 635 |
| 13 | 222 | Corby | 5,365 | 84,877 | 632 |
| 14 | 235 | High Peak | 3,980 | 63,945 | 622 |
| 15 | 238 | Leicester South | 5,895 | 95,258 | 619 |
| 16 | 251 | Louth and Horncastle | 3,905 | 64,821 | 602 |
| 17 | 256 | Kettering | 4,050 | 68,212 | 594 |
| 18 | 260 | Grantham and Stamford | 4,390 | 74,165 | 592 |
| 19 | 265 | North West Leicestershire | 4,180 | 70,934 | 589 |
| 20 | 266 | Gainsborough | 3,830 | 65,024 | 589 |
| 21 | 268 | Sleaford and North Hykeham | 4,585 | 78,627 | 583 |
| 22 | 279 | Northampton South | 4,080 | 70,595 | 578 |
| 23 | 300 | Charnwood | 3,915 | 70,009 | 559 |
| 24 | 340 | Leicester East | 4,175 | 79,245 | 527 |
| 25 | 363 | South Derbyshire | 3,730 | 74,295 | 502 |
| 26 | 367 | Boston and Skegness | 3,585 | 71,864 | 499 |
| 27 | 375 | North East Derbyshire | 3,025 | 61,561 | 491 |
| 28 | 400 | Mid Derbyshire | 2,640 | 55,534 | 475 |
| 29 | 428 | Amber Valley | 2,905 | 63,190 | 460 |
| 30 | 429 | Bassetlaw | 3,320 | 72,620 | 457 |
| 31 | 436 | Chesterfield | 2,950 | 64,936 | 454 |
| 32 | 442 | Loughborough | 3,660 | 81,423 | 450 |
| 33 | 443 | Erewash | 2,985 | 66,448 | 449 |
| 34 | 447 | Sherwood | 3,065 | 68,868 | 445 |
| 35 | 482 | Derby South | 3,330 | 78,683 | 423 |
| 36 | 492 | Nottingham South | 3,925 | 94,307 | 416 |
| 37 | 499 | Broxtowe | 2,795 | 67,822 | 412 |
| 38 | 503 | Derby North | 2,875 | 70,611 | 407 |
| 39 | 511 | Bolsover | 2,790 | 68,917 | 405 |
| 40 | 513 | Nottingham East | 3,425 | 84,713 | 404 |
| 41 | 522 | Gedling | 2,575 | 65,453 | 393 |
| 42 | 539 | Leicester West | 2,890 | 76,438 | 378 |
| 43 | 544 | Mansfield | 2,785 | 74,645 | 373 |
| 44 | 579 | Ashfield | 2,490 | 72,986 | 341 |
| 45 | 586 | Lincoln | 2,770 | 82,026 | 338 |
| 46 | 640 | Nottingham North | 1,670 | 66,066 | 253 |
Most Entrepreneurial Areas in the East of England
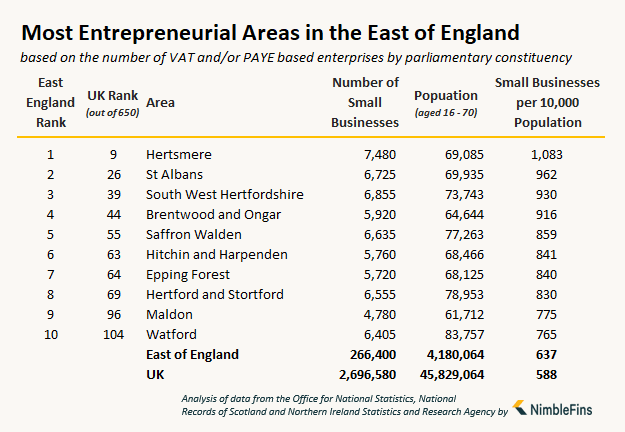
In the East of England overall, there were 637 small businesses per 10,000 working people in 2019. The best parliamentary constituency in the region was Hertsmere, where there were over 1,000 small businesses per 10K workers. In fact, 4 parliamentary constituencies make the cut for the top 50 in the UK: Hertsmere, St Albans, South West Hertfordshire and Brentwood and Ongar.
| East of England Rank | UK Rank | Local Authority | Number Small Businesses (0-49 employees) | Working Population (aged 16 to 70) | Small Businesses per 10,000 Working Population |
|---|---|---|---|---|---|
| 1 | 9 | Hertsmere | 7,480 | 69,085 | 1,083 |
| 2 | 26 | St Albans | 6,725 | 69,935 | 962 |
| 3 | 39 | South West Hertfordshire | 6,855 | 73,743 | 930 |
| 4 | 44 | Brentwood and Ongar | 5,920 | 64,644 | 916 |
| 5 | 55 | Saffron Walden | 6,635 | 77,263 | 859 |
| 6 | 63 | Hitchin and Harpenden | 5,760 | 68,466 | 841 |
| 7 | 64 | Epping Forest | 5,720 | 68,125 | 840 |
| 8 | 69 | Hertford and Stortford | 6,555 | 78,953 | 830 |
| 9 | 96 | Maldon | 4,780 | 61,712 | 775 |
| 10 | 104 | Watford | 6,405 | 83,757 | 765 |
| 11 | 109 | South Cambridgeshire | 5,905 | 77,966 | 757 |
| 12 | 119 | South East Cambridgeshire | 6,025 | 81,683 | 738 |
| 13 | 124 | North East Hertfordshire | 4,895 | 67,467 | 726 |
| 14 | 150 | Suffolk Coastal | 4,640 | 66,269 | 700 |
| 15 | 152 | South Suffolk | 4,335 | 62,154 | 697 |
| 16 | 157 | Basildon and Billericay | 4,445 | 64,394 | 690 |
| 17 | 158 | Mid Bedfordshire | 5,375 | 77,878 | 690 |
| 18 | 166 | Witham | 4,235 | 62,180 | 681 |
| 19 | 170 | Central Suffolk and North Ipswich | 4,560 | 67,286 | 678 |
| 20 | 180 | Broxbourne | 4,600 | 68,595 | 671 |
| 21 | 184 | Hemel Hempstead | 4,875 | 73,227 | 666 |
| 22 | 200 | North East Bedfordshire | 5,230 | 80,083 | 653 |
| 23 | 201 | Braintree | 4,445 | 68,134 | 652 |
| 24 | 209 | Harwich and North Essex | 4,195 | 64,878 | 647 |
| 25 | 212 | Broadland | 4,195 | 65,284 | 643 |
| 26 | 213 | Huntingdon | 5,260 | 81,913 | 642 |
| 27 | 221 | Rayleigh and Wickford | 4,285 | 67,704 | 633 |
| 28 | 226 | South Norfolk | 4,585 | 72,990 | 628 |
| 29 | 229 | North West Cambridgeshire | 5,705 | 90,967 | 627 |
| 30 | 236 | North Norfolk | 3,410 | 54,991 | 620 |
| 31 | 240 | Harlow | 4,045 | 65,469 | 618 |
| 32 | 248 | Luton South | 4,990 | 82,633 | 604 |
| 33 | 249 | Southend West | 3,725 | 61,741 | 603 |
| 34 | 254 | West Suffolk | 4,775 | 79,918 | 597 |
| 35 | 257 | Chelmsford | 4,550 | 76,777 | 593 |
| 36 | 264 | Mid Norfolk | 4,145 | 70,206 | 590 |
| 37 | 270 | Welwyn Hatfield | 4,835 | 83,050 | 582 |
| 38 | 275 | Bury St Edmunds | 4,600 | 79,200 | 581 |
| 39 | 290 | South West Bedfordshire | 4,410 | 77,534 | 569 |
| 40 | 293 | Castle Point | 3,350 | 58,980 | 568 |
| 41 | 296 | Stevenage | 3,805 | 67,305 | 565 |
| 42 | 298 | Thurrock | 5,055 | 89,739 | 563 |
| 43 | 304 | Rochford and Southend East | 4,020 | 72,186 | 557 |
| 44 | 312 | South West Norfolk | 3,930 | 71,333 | 551 |
| 45 | 318 | North East Cambridgeshire | 4,370 | 80,013 | 546 |
| 46 | 325 | North West Norfolk | 3,380 | 62,750 | 539 |
| 47 | 336 | Cambridge | 4,525 | 85,593 | 529 |
| 48 | 337 | Peterborough | 4,395 | 83,146 | 529 |
| 49 | 339 | Bedford | 3,835 | 72,617 | 528 |
| 50 | 366 | South Basildon and East Thurrock | 3,445 | 68,920 | 500 |
| 51 | 414 | Norwich South | 3,575 | 76,326 | 468 |
| 52 | 419 | Waveney | 3,140 | 67,794 | 463 |
| 53 | 439 | Colchester | 3,985 | 88,072 | 452 |
| 54 | 451 | Ipswich | 3,450 | 77,908 | 443 |
| 55 | 475 | Great Yarmouth | 2,770 | 64,995 | 426 |
| 56 | 500 | Luton North | 2,655 | 64,712 | 410 |
| 57 | 517 | Clacton | 2,220 | 55,495 | 400 |
| 58 | 525 | Norwich North | 2,385 | 60,821 | 392 |
Most Entrepreneurial Areas in London
The capital has the highest rate of entrepreneurship, with an average of 808 small businesses per 10K workers overall—this is 37% higher than the UK average. In fact, 11 London parliamentary constituencies made the top 50—which means London took over 20% of the top 50 spots.

| London Rank | UK Rank | Local Authority | Number Small Businesses (0-49 employees) | Working Population (aged 16 to 70) | Small Businesses per 10,000 Working Population |
|---|---|---|---|---|---|
| 1 | 1 | Holborn and St Pancras | 25,350 | 124,748 | 2,032 |
| 2 | 2 | Islington South and Finsbury | 15,445 | 99,333 | 1,555 |
| 3 | 3 | Hackney South and Shoreditch | 14,710 | 106,026 | 1,387 |
| 4 | 6 | Kensington | 9,760 | 82,501 | 1,183 |
| 5 | 7 | Finchley and Golders Green | 10,565 | 92,284 | 1,145 |
| 6 | 11 | Chelsea and Fulham | 8,590 | 79,734 | 1,077 |
| 7 | 17 | Wimbledon | 7,115 | 70,223 | 1,013 |
| 8 | 23 | Ealing Central and Acton | 8,790 | 90,064 | 976 |
| 9 | 35 | Ruislip; Northwood and Pinner | 6,030 | 64,297 | 938 |
| 10 | 37 | Richmond Park | 8,215 | 88,093 | 933 |
| 11 | 48 | Twickenham | 7,375 | 81,279 | 907 |
| 12 | 51 | Harrow East | 6,540 | 73,523 | 890 |
| 13 | 53 | Bermondsey and Old Southwark | 10,300 | 118,511 | 869 |
| 14 | 57 | Harrow West | 6,565 | 77,088 | 852 |
| 15 | 58 | Enfield - Southgate | 6,140 | 72,304 | 849 |
| 16 | 59 | Brentford and Isleworth | 8,200 | 97,003 | 845 |
| 17 | 62 | Hampstead and Kilburn | 9,220 | 109,278 | 844 |
| 18 | 71 | Hammersmith | 7,315 | 89,068 | 821 |
| 19 | 81 | Chipping Barnet | 6,420 | 81,077 | 792 |
| 20 | 107 | Hornsey and Wood Green | 7,125 | 93,484 | 762 |
| 21 | 115 | Hendon | 7,385 | 99,343 | 743 |
| 22 | 120 | Bethnal Green and Bow | 8,650 | 117,684 | 735 |
| 23 | 128 | Bromley and Chislehurst | 4,695 | 65,108 | 721 |
| 24 | 132 | Kingston and Surbiton | 6,565 | 91,314 | 719 |
| 25 | 133 | Battersea | 6,715 | 93,741 | 716 |
| 26 | 140 | Hackney North and Stoke Newington | 7,320 | 103,559 | 707 |
| 27 | 141 | Beckenham | 4,425 | 62,667 | 706 |
| 28 | 145 | Brent North | 6,630 | 94,371 | 703 |
| 29 | 160 | Croydon South | 5,465 | 79,478 | 688 |
| 30 | 162 | Orpington | 4,085 | 59,779 | 683 |
| 31 | 163 | Putney | 5,010 | 73,428 | 682 |
| 32 | 168 | Ilford South | 6,840 | 100,580 | 680 |
| 33 | 173 | Chingford and Woodford Green | 4,335 | 64,093 | 676 |
| 34 | 174 | Sutton and Cheam | 4,745 | 70,208 | 676 |
| 35 | 185 | Ilford North | 5,150 | 77,383 | 666 |
| 36 | 218 | Poplar and Limehouse | 8,220 | 128,948 | 637 |
| 37 | 225 | Vauxhall | 6,325 | 100,412 | 630 |
| 38 | 230 | Hornchurch and Upminster | 4,670 | 74,529 | 627 |
| 39 | 231 | Leyton and Wanstead | 5,070 | 81,093 | 625 |
| 40 | 232 | Brent Central | 6,610 | 106,091 | 623 |
| 41 | 233 | Ealing - Southall | 4,215 | 67,675 | 623 |
| 42 | 234 | Westminster North | 6,145 | 98,696 | 623 |
| 43 | 241 | Uxbridge and South Ruislip | 4,900 | 79,343 | 618 |
| 44 | 243 | Tooting | 5,085 | 82,475 | 617 |
| 45 | 244 | Dulwich and West Norwood | 5,145 | 83,737 | 614 |
| 46 | 259 | Ealing North | 4,790 | 80,884 | 592 |
| 47 | 267 | Walthamstow | 4,995 | 85,007 | 588 |
| 48 | 283 | Romford | 4,180 | 72,586 | 576 |
| 49 | 285 | Old Bexley and Sidcup | 3,465 | 60,370 | 574 |
| 50 | 287 | Islington North | 5,215 | 90,924 | 574 |
| 51 | 289 | Greenwich and Woolwich | 5,595 | 98,349 | 569 |
| 52 | 308 | Croydon Central | 4,670 | 84,332 | 554 |
| 53 | 316 | Mitcham and Morden | 4,140 | 75,576 | 548 |
| 54 | 320 | Carshalton and Wallington | 3,860 | 70,734 | 546 |
| 55 | 334 | Tottenham | 5,485 | 103,598 | 529 |
| 56 | 342 | Barking | 4,965 | 94,461 | 526 |
| 57 | 343 | Feltham and Heston | 4,930 | 93,811 | 526 |
| 58 | 348 | Hayes and Harlington | 4,610 | 88,539 | 521 |
| 59 | 364 | Croydon North | 5,135 | 102,315 | 502 |
| 60 | 370 | Enfield North | 3,665 | 73,715 | 497 |
| 61 | 373 | Eltham | 3,250 | 65,707 | 495 |
| 62 | 377 | Dagenham and Rainham | 3,665 | 74,934 | 489 |
| 63 | 378 | Bexleyheath and Crayford | 3,155 | 64,513 | 489 |
| 64 | 379 | Lewisham West and Penge | 4,070 | 83,528 | 487 |
| 65 | 391 | East Ham | 5,595 | 116,168 | 482 |
| 66 | 393 | Lewisham - Deptford | 4,705 | 98,181 | 479 |
| 67 | 395 | West Ham | 6,810 | 142,201 | 479 |
| 68 | 397 | Edmonton | 3,905 | 81,714 | 478 |
| 69 | 418 | Streatham | 4,405 | 95,027 | 464 |
| 70 | 468 | Camberwell and Peckham | 4,155 | 96,810 | 429 |
| 71 | 481 | Erith and Thamesmead | 3,580 | 84,582 | 423 |
| 72 | 484 | Lewisham East | 3,355 | 79,341 | 423 |
Most Entrepreneurial Areas in the North East
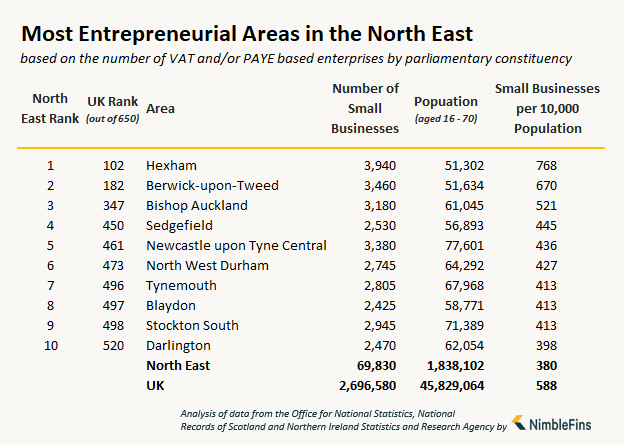
The North East has the lowest rate of entrepreneurship in the UK, with just 380 small businesses per 10,000 working-age people—this is 35% lower than the UK average of 588.
The highest-ranking parliamentary constituency in the North East is Hexham (ranking 102nd out of 649 constituencies in our study) which had 768 small businesses per 10K working population, followed by Berwick-upon-Tweed and Bishop Auckland.
| North East Rank | UK Rank | Local Authority | Number Small Businesses (0-49 employees) | Working Population (aged 16 to 70) | Small Businesses per 10,000 Working Population |
|---|---|---|---|---|---|
| 1 | 102 | Hexham | 3,940 | 51,302 | 768 |
| 2 | 182 | Berwick-upon-Tweed | 3,460 | 51,634 | 670 |
| 3 | 347 | Bishop Auckland | 3,180 | 61,045 | 521 |
| 4 | 450 | Sedgefield | 2,530 | 56,893 | 445 |
| 5 | 461 | Newcastle upon Tyne Central | 3,380 | 77,601 | 436 |
| 6 | 473 | North West Durham | 2,745 | 64,292 | 427 |
| 7 | 496 | Tynemouth | 2,805 | 67,968 | 413 |
| 8 | 497 | Blaydon | 2,425 | 58,771 | 413 |
| 9 | 498 | Stockton South | 2,945 | 71,389 | 413 |
| 10 | 520 | Darlington | 2,470 | 62,054 | 398 |
| 11 | 532 | Stockton North | 2,415 | 62,636 | 386 |
| 12 | 552 | Gateshead | 2,560 | 69,561 | 368 |
| 13 | 557 | Middlesbrough | 2,415 | 66,405 | 364 |
| 14 | 565 | Hartlepool | 2,255 | 63,707 | 354 |
| 15 | 572 | Wansbeck | 1,960 | 56,415 | 347 |
| 16 | 574 | Sunderland Central | 2,495 | 71,985 | 347 |
| 17 | 580 | Middlesbrough South and East Cleveland | 2,125 | 62,372 | 341 |
| 18 | 585 | Jarrow | 1,935 | 57,291 | 338 |
| 19 | 588 | Newcastle upon Tyne North | 2,085 | 61,901 | 337 |
| 20 | 594 | City of Durham | 2,535 | 77,048 | 329 |
| 21 | 599 | North Durham | 1,945 | 60,120 | 324 |
| 22 | 601 | North Tyneside | 2,395 | 74,575 | 321 |
| 23 | 606 | Newcastle upon Tyne East | 2,595 | 81,455 | 319 |
| 24 | 610 | South Shields | 1,830 | 58,077 | 315 |
| 25 | 612 | Redcar | 1,830 | 58,644 | 312 |
| 26 | 619 | Blyth Valley | 1,780 | 57,990 | 307 |
| 27 | 627 | Easington | 1,605 | 56,375 | 285 |
| 28 | 634 | Washington and Sunderland West | 1,640 | 60,199 | 272 |
| 29 | 639 | Houghton and Sunderland South | 1,550 | 60,503 | 256 |
Most Entrepreneurial Areas in the North West
The North West has 521 small businesses per 10K working people, ranking the region 8th in the UK. The highest-ranking parliamentary constituency in the North West is Tatton, which had 6,105 small businesses yielding a rate of 1,079 small businesses per 10K working people.
Overall, four constituencies made the top 50 in the UK, with all four scoring over 900 small businesses per 10K working people.

| North West Rank | UK Rank | Local Authority | Number Small Businesses (0-49 employees) | Working Population (aged 16 to 70) | Small Businesses per 10,000 Working Population |
|---|---|---|---|---|---|
| 1 | 10 | Tatton | 6,105 | 56,569 | 1,079 |
| 2 | 15 | Penrith and The Border | 5,700 | 55,297 | 1,031 |
| 3 | 32 | Altrincham and Sale West | 6,335 | 66,822 | 948 |
| 4 | 41 | Westmorland and Lonsdale | 5,135 | 55,722 | 922 |
| 5 | 54 | Manchester Central | 11,515 | 133,335 | 864 |
| 6 | 88 | Warrington South | 6,015 | 76,777 | 783 |
| 7 | 93 | Eddisbury | 4,725 | 60,581 | 780 |
| 8 | 105 | Macclesfield | 4,730 | 61,856 | 765 |
| 9 | 122 | Salford and Eccles | 6,710 | 92,359 | 727 |
| 10 | 127 | Ribble Valley | 4,955 | 68,513 | 723 |
| 11 | 151 | Congleton | 4,455 | 63,874 | 697 |
| 12 | 153 | Cheadle | 4,280 | 61,382 | 697 |
| 13 | 171 | Wyre and Preston North | 4,050 | 59,812 | 677 |
| 14 | 197 | City of Chester | 4,415 | 67,301 | 656 |
| 15 | 237 | Bury North | 3,765 | 60,736 | 620 |
| 16 | 245 | Bury South | 4,155 | 67,855 | 612 |
| 17 | 252 | Fylde | 3,415 | 56,943 | 600 |
| 18 | 261 | Workington | 3,175 | 53,656 | 592 |
| 19 | 276 | Bolton North East | 3,855 | 66,384 | 581 |
| 20 | 278 | Copeland | 3,080 | 53,128 | 580 |
| 21 | 294 | Stockport | 3,545 | 62,479 | 567 |
| 22 | 295 | Blackley and Broughton | 4,655 | 82,221 | 566 |
| 23 | 301 | Hazel Grove | 2,900 | 51,861 | 559 |
| 24 | 303 | Weaver Vale | 3,440 | 61,705 | 557 |
| 25 | 305 | South Ribble | 3,720 | 66,844 | 557 |
| 26 | 323 | West Lancashire | 3,595 | 66,389 | 542 |
| 27 | 329 | Liverpool - Riverside | 6,025 | 112,396 | 536 |
| 28 | 341 | Stretford and Urmston | 3,640 | 69,236 | 526 |
| 29 | 346 | Chorley | 3,735 | 71,564 | 522 |
| 30 | 349 | Carlisle | 3,045 | 58,916 | 517 |
| 31 | 354 | Barrow and Furness | 3,005 | 58,567 | 513 |
| 32 | 369 | Bolton West | 3,270 | 65,700 | 498 |
| 33 | 382 | Southport | 2,920 | 60,103 | 486 |
| 34 | 387 | Preston | 3,355 | 69,379 | 484 |
| 35 | 392 | Rossendale and Darwen | 3,270 | 68,212 | 479 |
| 36 | 394 | Crewe and Nantwich | 3,620 | 75,543 | 479 |
| 37 | 398 | Garston and Halewood | 3,240 | 67,835 | 478 |
| 38 | 399 | Warrington North | 3,180 | 66,801 | 476 |
| 39 | 404 | Wirral South | 2,265 | 47,713 | 475 |
| 40 | 411 | Blackburn | 3,465 | 73,772 | 470 |
| 41 | 416 | Bolton South East | 3,340 | 71,352 | 468 |
| 42 | 423 | Wirral West | 2,075 | 44,915 | 462 |
| 43 | 425 | Lancaster and Fleetwood | 3,075 | 66,730 | 461 |
| 44 | 431 | Morecambe and Lunesdale | 2,685 | 58,935 | 456 |
| 45 | 435 | Heywood and Middleton | 3,355 | 73,818 | 454 |
| 46 | 437 | Pendle | 2,785 | 61,424 | 453 |
| 47 | 444 | Sefton Central | 2,405 | 53,706 | 448 |
| 48 | 448 | Blackpool South | 2,405 | 54,054 | 445 |
| 49 | 463 | Burnley | 2,575 | 59,190 | 435 |
| 50 | 465 | Hyndburn | 2,705 | 62,244 | 435 |
| 51 | 467 | Oldham East and Saddleworth | 3,105 | 71,719 | 433 |
| 52 | 478 | Denton and Reddish | 2,545 | 60,010 | 424 |
| 53 | 480 | Wigan | 3,080 | 72,706 | 424 |
| 54 | 489 | Leigh | 3,075 | 73,507 | 418 |
| 55 | 490 | Manchester - Withington | 3,140 | 75,182 | 418 |
| 56 | 494 | Stalybridge and Hyde | 2,685 | 64,789 | 414 |
| 57 | 501 | Rochdale | 3,145 | 76,666 | 410 |
| 58 | 507 | Worsley and Eccles South | 2,835 | 69,856 | 406 |
| 59 | 509 | Oldham West and Royton | 2,935 | 72,426 | 405 |
| 60 | 510 | Ellesmere Port and Neston | 2,400 | 59,278 | 405 |
| 61 | 518 | Wythenshawe and Sale East | 2,945 | 73,647 | 400 |
| 62 | 519 | Ashton-under-Lyne | 2,540 | 63,773 | 398 |
| 63 | 535 | Halton | 2,580 | 67,624 | 382 |
| 64 | 542 | Birkenhead | 2,320 | 61,915 | 375 |
| 65 | 547 | St Helens South and Whiston | 2,610 | 70,356 | 371 |
| 66 | 551 | St Helens North | 2,485 | 67,466 | 368 |
| 67 | 575 | Bootle | 2,395 | 69,363 | 345 |
| 68 | 576 | Knowsley | 2,545 | 73,801 | 345 |
| 69 | 577 | Blackpool North and Cleveleys | 1,895 | 55,035 | 344 |
| 70 | 578 | Makerfield | 2,355 | 68,465 | 344 |
| 71 | 600 | Liverpool - Wavertree | 2,190 | 68,160 | 321 |
| 72 | 602 | Wallasey | 1,965 | 61,482 | 320 |
| 73 | 613 | Manchester - Gorton | 2,685 | 86,121 | 312 |
| 74 | 635 | Liverpool - Walton | 1,750 | 65,221 | 268 |
| 75 | 648 | Liverpool - West Derby | 1,495 | 64,207 | 233 |
Most Entrepreneurial Areas in the Northern Ireland
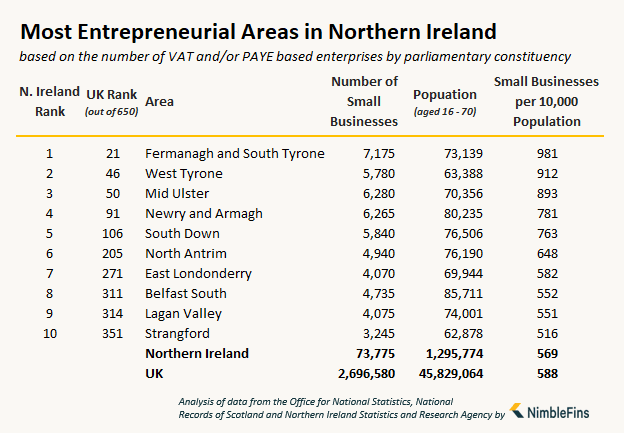
Northern Ireland ranked 5th in the UK for entrepreneurs with 569 small businesses for every 10K working-age people, based on 73,775 small businesses in 2019. Overall, three parliamentary constituencies from Northern Ireland made the top 50 in the UK. The parliamentary constituency with the highest score was Fermanagh and South Tyrone, with a score of 981 small businesses for every 10K working people, followed by West Tyrone, Mid Ulster and Newry and Armagh.
| Northern Ireland Rank | UK Rank | Local Authority | Number Small Businesses (0-49 employees) | Working Population (aged 16 to 70) | Small Businesses per 10,000 Working Population |
|---|---|---|---|---|---|
| 1 | 21 | Fermanagh and South Tyrone | 7,175 | 73,139 | 981 |
| 2 | 46 | West Tyrone | 5,780 | 63,388 | 912 |
| 3 | 50 | Mid Ulster | 6,280 | 70,356 | 893 |
| 4 | 91 | Newry and Armagh | 6,265 | 80,235 | 781 |
| 5 | 106 | South Down | 5,840 | 76,506 | 763 |
| 6 | 205 | North Antrim | 4,940 | 76,190 | 648 |
| 7 | 271 | East Londonderry | 4,070 | 69,944 | 582 |
| 8 | 311 | Belfast South | 4,735 | 85,711 | 552 |
| 9 | 314 | Lagan Valley | 4,075 | 74,001 | 551 |
| 10 | 351 | Strangford | 3,245 | 62,878 | 516 |
| 11 | 361 | South Antrim | 3,575 | 70,620 | 506 |
| 12 | 472 | Upper Bann | 3,705 | 86,735 | 427 |
| 13 | 515 | East Antrim | 2,510 | 62,466 | 402 |
| 14 | 527 | North Down | 2,395 | 61,435 | 390 |
| 15 | 533 | Belfast East | 2,550 | 66,193 | 385 |
| 16 | 564 | Foyle | 2,535 | 71,590 | 354 |
| 17 | 569 | Belfast North | 2,480 | 70,868 | 350 |
| 18 | 641 | Belfast West | 1,620 | 64,129 | 253 |
Most Entrepreneurial Areas in Scotland
Scotland ranked 11th out of the 12 UK regions for entrepreneurship, with 452 small businesses per 10K working-age people (23% below the UK average of 588). There were 2 parliamentary constituencies from Scotland in the UK top 50.
The highest-ranking constituency in Scotland was Orkney and Shetland, where 2,945 small businesses yielded a rate of 955 small businesses per 10,000 working-age people. Next were Glasgow Central, West Aberdeenshire & Kincardine and Edinburgh North and Leith.

| Scotland Rank | UK Rank | Local Authority | Number Small Businesses (0-49 employees) | Working Population (aged 16 to 70) | Small Businesses per 10,000 Working Population |
|---|---|---|---|---|---|
| 1 | 28 | Orkney and Shetland | 2,945 | 30,848 | 955 |
| 2 | 31 | Glasgow Central | 8,225 | 86,541 | 950 |
| 3 | 83 | West Aberdeenshire and Kincardine | 5,265 | 66,510 | 792 |
| 4 | 90 | Edinburgh North and Leith | 7,040 | 90,108 | 781 |
| 5 | 92 | Ross; Skye and Lochaber | 3,730 | 47,806 | 780 |
| 6 | 95 | Caithness; Sutherland and Easter Ross | 3,160 | 40,763 | 775 |
| 7 | 116 | Banff and Buchan | 4,670 | 62,897 | 742 |
| 8 | 154 | Aberdeen South | 4,865 | 70,272 | 692 |
| 9 | 164 | Gordon | 4,920 | 72,111 | 682 |
| 10 | 179 | Dumfriesshire; Clydesdale and Tweeddale | 3,890 | 58,002 | 671 |
| 11 | 199 | Na h-Eileanan an Iar | 1,170 | 17,861 | 655 |
| 12 | 210 | Argyll and Bute | 3,745 | 58,248 | 643 |
| 13 | 223 | Berwickshire; Roxburgh and Selkirk | 4,030 | 63,786 | 632 |
| 14 | 253 | Dumfries and Galloway | 3,855 | 64,304 | 599 |
| 15 | 273 | Stirling | 3,870 | 66,568 | 581 |
| 16 | 324 | Perth and North Perthshire | 3,630 | 67,189 | 540 |
| 17 | 335 | Angus | 3,090 | 58,423 | 529 |
| 18 | 353 | Inverness; Nairn; Badenoch and Strathspey | 3,790 | 73,631 | 515 |
| 19 | 383 | Moray | 3,200 | 65,897 | 486 |
| 20 | 403 | Ochil and South Perthshire | 3,435 | 72,297 | 475 |
| 21 | 409 | Lanark and Hamilton East | 3,210 | 68,316 | 470 |
| 22 | 446 | North East Fife | 2,645 | 59,244 | 446 |
| 23 | 449 | East Dunbartonshire | 2,480 | 55,759 | 445 |
| 24 | 457 | East Lothian | 3,185 | 72,855 | 437 |
| 25 | 462 | Ayr; Carrick and Cumnock | 2,715 | 62,388 | 435 |
| 26 | 469 | Kirkcaldy and Cowdenbeath | 2,890 | 67,399 | 429 |
| 27 | 486 | Edinburgh West | 2,970 | 70,458 | 422 |
| 28 | 491 | East Renfrewshire | 2,625 | 62,971 | 417 |
| 29 | 512 | Edinburgh South West | 3,245 | 80,209 | 405 |
| 30 | 523 | Paisley and Renfrewshire North | 2,570 | 65,397 | 393 |
| 31 | 529 | Midlothian | 2,450 | 63,279 | 387 |
| 32 | 530 | Kilmarnock and Loudoun | 2,620 | 67,698 | 387 |
| 33 | 538 | East Kilbride; Strathaven and Lesmahagow | 2,745 | 72,423 | 379 |
| 34 | 541 | Edinburgh East | 3,235 | 86,163 | 375 |
| 35 | 550 | Central Ayrshire | 2,185 | 59,216 | 369 |
| 36 | 554 | Edinburgh South | 2,430 | 66,473 | 366 |
| 37 | 555 | North Ayrshire and Arran | 2,320 | 63,504 | 365 |
| 38 | 568 | Dunfermline and West Fife | 2,505 | 71,315 | 351 |
| 39 | 570 | Linlithgow and East Falkirk | 2,900 | 82,976 | 349 |
| 40 | 573 | Livingston | 2,745 | 79,019 | 347 |
| 41 | 590 | Coatbridge; Chryston and Bellshill | 2,260 | 67,764 | 334 |
| 42 | 595 | Glasgow North | 2,105 | 64,339 | 327 |
| 43 | 596 | Paisley and Renfrewshire South | 1,995 | 61,080 | 327 |
| 44 | 597 | Falkirk | 2,570 | 79,087 | 325 |
| 45 | 603 | Dundee East | 1,970 | 61,739 | 319 |
| 46 | 605 | Dundee West | 2,100 | 65,908 | 319 |
| 47 | 616 | Airdrie and Shotts | 1,885 | 61,338 | 307 |
| 48 | 617 | Aberdeen North | 2,375 | 77,296 | 307 |
| 49 | 620 | Rutherglen and Hamilton West | 2,285 | 74,916 | 305 |
| 50 | 621 | West Dunbartonshire | 1,890 | 62,560 | 302 |
| 51 | 622 | Cumbernauld; Kilsyth and Kirkintilloch East | 1,850 | 61,317 | 302 |
| 52 | 625 | Glasgow South | 1,915 | 65,734 | 291 |
| 53 | 626 | Inverclyde | 1,570 | 54,304 | 289 |
| 54 | 629 | Motherwell and Wishaw | 1,870 | 66,493 | 281 |
| 55 | 631 | Glenrothes | 1,675 | 60,258 | 278 |
| 56 | 632 | Glasgow East | 1,900 | 68,493 | 277 |
| 57 | 643 | Glasgow South West | 1,585 | 63,246 | 251 |
| 58 | 645 | Glasgow North West | 1,585 | 64,882 | 244 |
| 59 | 647 | Glasgow North East | 1,540 | 64,718 | 238 |
Most Entrepreneurial Areas in the South East
The South East ranked as the 2nd most entrepreneurial region in the UK behind London, with 410,735 small businesses and a rate of 663 small businesses per 10K of working population. This rate is 13% higher than the UK average of 588. Eleven parliamentary constituencies from the South East made the UK top 50 (the same number as London).
The highest-rating constituency in the South East is Beaconsfield, where 7,440 small businesses yielded a rate of 1,118 small businesses per 10K working people. Four more constituencies sported rates higher than 1,000 small businesses per 10K working people: Henley, South West Surrey, Chesham and Amersham and Mole Valley.

| South East Rank | UK Rank | Local Authority | Number Small Businesses (0-49 employees) | Working Population (aged 16 to 70) | Small Businesses per 10,000 Working Population |
|---|---|---|---|---|---|
| 1 | 8 | Beaconsfield | 7,440 | 66,538 | 1,118 |
| 2 | 12 | Henley | 6,825 | 65,479 | 1,042 |
| 3 | 13 | South West Surrey | 7,155 | 69,195 | 1,034 |
| 4 | 16 | Chesham and Amersham | 6,295 | 61,346 | 1,026 |
| 5 | 18 | Mole Valley | 6,430 | 63,772 | 1,008 |
| 6 | 25 | Buckingham | 6,965 | 71,893 | 969 |
| 7 | 29 | Meon Valley | 6,035 | 63,242 | 954 |
| 8 | 34 | Arundel and South Downs | 6,100 | 64,835 | 941 |
| 9 | 43 | Esher and Walton | 6,795 | 73,966 | 919 |
| 10 | 45 | Windsor | 6,630 | 72,569 | 914 |
| 11 | 49 | Maidenhead | 6,405 | 70,796 | 905 |
| 12 | 52 | Brighton - Pavilion | 7,860 | 89,767 | 876 |
| 13 | 56 | Newbury | 6,435 | 75,340 | 854 |
| 14 | 65 | East Hampshire | 5,495 | 65,862 | 834 |
| 15 | 68 | Sevenoaks | 5,285 | 63,568 | 831 |
| 16 | 72 | Wealden | 5,885 | 71,894 | 819 |
| 17 | 74 | Chichester | 5,840 | 71,739 | 814 |
| 18 | 75 | North East Hampshire | 5,500 | 67,708 | 812 |
| 19 | 76 | Runnymede and Weybridge | 6,270 | 77,823 | 806 |
| 20 | 77 | New Forest West | 4,245 | 52,862 | 803 |
| 21 | 86 | East Surrey | 5,970 | 75,608 | 790 |
| 22 | 89 | Tunbridge Wells | 5,660 | 72,407 | 782 |
| 23 | 94 | Woking | 5,605 | 72,211 | 776 |
| 24 | 97 | Tonbridge and Malling | 5,525 | 71,380 | 774 |
| 25 | 98 | Wokingham | 5,920 | 76,503 | 774 |
| 26 | 101 | Reigate | 5,480 | 71,339 | 768 |
| 27 | 103 | Witney | 5,635 | 73,512 | 767 |
| 28 | 110 | Winchester | 5,100 | 67,465 | 756 |
| 29 | 111 | Romsey and Southampton North | 4,755 | 63,206 | 752 |
| 30 | 113 | Lewes | 4,505 | 60,164 | 749 |
| 31 | 117 | Hove | 5,600 | 75,463 | 742 |
| 32 | 125 | Milton Keynes North | 6,635 | 91,486 | 725 |
| 33 | 126 | Ashford | 5,970 | 82,521 | 723 |
| 34 | 135 | Eastleigh | 5,470 | 76,416 | 716 |
| 35 | 138 | Horsham | 5,495 | 77,510 | 709 |
| 36 | 139 | Mid Sussex | 5,385 | 76,065 | 708 |
| 37 | 142 | Surrey Heath | 5,200 | 73,670 | 706 |
| 38 | 143 | Bexhill and Battle | 4,745 | 67,238 | 706 |
| 39 | 146 | Epsom and Ewell | 5,160 | 73,456 | 702 |
| 40 | 156 | Spelthorne | 4,645 | 67,191 | 691 |
| 41 | 169 | Banbury | 5,785 | 85,355 | 678 |
| 42 | 187 | North West Hampshire | 4,860 | 73,162 | 664 |
| 43 | 188 | Guildford | 5,490 | 82,729 | 664 |
| 44 | 191 | Wantage | 5,440 | 82,307 | 661 |
| 45 | 193 | Maidstone and The Weald | 4,900 | 74,408 | 659 |
| 46 | 194 | Faversham and Mid Kent | 4,380 | 66,581 | 658 |
| 47 | 203 | Milton Keynes South | 5,960 | 91,676 | 650 |
| 48 | 208 | Reading East | 5,355 | 82,805 | 647 |
| 49 | 227 | Dartford | 5,025 | 80,101 | 627 |
| 50 | 246 | Oxford West and Abingdon | 4,580 | 75,211 | 609 |
| 51 | 247 | Slough | 5,845 | 96,034 | 609 |
| 52 | 263 | Fareham | 4,050 | 68,470 | 591 |
| 53 | 272 | New Forest East | 3,575 | 61,468 | 582 |
| 54 | 280 | Rochester and Strood | 4,530 | 78,467 | 577 |
| 55 | 281 | Aylesbury | 4,945 | 85,659 | 577 |
| 56 | 302 | Gravesham | 3,985 | 71,345 | 559 |
| 57 | 307 | Reading West | 3,885 | 70,012 | 555 |
| 58 | 310 | Basingstoke | 4,425 | 80,011 | 553 |
| 59 | 321 | Southampton - Itchen | 4,265 | 78,291 | 545 |
| 60 | 327 | Bracknell | 4,180 | 77,708 | 538 |
| 61 | 328 | Folkestone and Hythe | 4,205 | 78,246 | 537 |
| 62 | 330 | Worthing West | 3,390 | 63,241 | 536 |
| 63 | 345 | East Worthing and Shoreham | 3,455 | 65,967 | 524 |
| 64 | 360 | Aldershot | 3,715 | 73,375 | 506 |
| 65 | 368 | Hastings and Rye | 3,735 | 75,017 | 498 |
| 66 | 380 | South Thanet | 3,205 | 65,883 | 486 |
| 67 | 384 | Portsmouth North | 3,290 | 67,786 | 485 |
| 68 | 389 | Isle of Wight | 4,455 | 92,277 | 483 |
| 69 | 417 | Havant | 2,960 | 63,521 | 466 |
| 70 | 420 | Sittingbourne and Sheppey | 3,725 | 80,597 | 462 |
| 71 | 422 | Eastbourne | 3,320 | 71,847 | 462 |
| 72 | 427 | North Thanet | 2,980 | 64,805 | 460 |
| 73 | 440 | Canterbury | 3,910 | 86,570 | 452 |
| 74 | 445 | Bognor Regis and Littlehampton | 3,130 | 70,018 | 447 |
| 75 | 459 | Crawley | 3,385 | 77,695 | 436 |
| 76 | 460 | Chatham and Aylesford | 3,055 | 70,121 | 436 |
| 77 | 502 | Brighton - Kemptown | 2,855 | 69,973 | 408 |
| 78 | 516 | Southampton - Test | 3,275 | 81,755 | 401 |
| 79 | 531 | Dover | 2,675 | 69,222 | 386 |
| 80 | 543 | Gillingham and Rainham | 2,610 | 69,699 | 374 |
| 81 | 558 | Oxford East | 3,280 | 90,416 | 363 |
| 82 | 571 | Gosport | 2,320 | 66,383 | 349 |
| 83 | 593 | Portsmouth South | 2,865 | 86,759 | 330 |
Most Entrepreneurial Areas in the South West
The South West region ranked 4th in the UK for the rate of entrepreneurship, with a rate of 615 small businesses per 10,000 working-age people (231,885 small businesses for 3,768,264 working-age people).
The highest-ranking parliamentary constituency in the South West is The Cotswolds, with 1,000 small businesses per 10,000 working-age people—in other words, 1 small business for every 10 people. The Cotswolds was followed by Central Devon and West Dorset, with rates of 924 and 844 small businesses per 10,000 working-age people, respectively.

| South West Rank | UK Rank | Local Authority | Number Small Businesses (0-49 employees) | Working Population (aged 16 to 70) | Small Businesses per 10,000 Working Population |
|---|---|---|---|---|---|
| 1 | 20 | The Cotswolds | 6,775 | 67,724 | 1,000 |
| 2 | 40 | Central Devon | 5,725 | 61,954 | 924 |
| 3 | 60 | West Dorset | 5,310 | 62,910 | 844 |
| 4 | 61 | North Cornwall | 5,190 | 61,501 | 844 |
| 5 | 66 | Somerton and Frome | 5,900 | 70,841 | 833 |
| 6 | 70 | North Wiltshire | 5,250 | 63,664 | 825 |
| 7 | 73 | Tiverton and Honiton | 5,425 | 66,507 | 816 |
| 8 | 84 | Totnes | 4,395 | 55,523 | 792 |
| 9 | 87 | Torridge and West Devon | 5,265 | 66,784 | 788 |
| 10 | 99 | North Dorset | 4,940 | 63,898 | 773 |
| 11 | 100 | North Devon | 4,865 | 63,293 | 769 |
| 12 | 114 | North Somerset | 4,905 | 65,932 | 744 |
| 13 | 121 | Bristol West | 8,410 | 115,094 | 731 |
| 14 | 123 | Stroud | 5,220 | 71,877 | 726 |
| 15 | 130 | Wells | 5,045 | 70,055 | 720 |
| 16 | 136 | Forest of Dean | 4,375 | 61,351 | 713 |
| 17 | 137 | Truro and Falmouth | 4,685 | 65,839 | 712 |
| 18 | 149 | Christchurch | 3,710 | 52,859 | 702 |
| 19 | 161 | Wycombe | 5,130 | 75,053 | 684 |
| 20 | 175 | Thornbury and Yate | 3,920 | 58,088 | 675 |
| 21 | 176 | Cheltenham | 4,905 | 72,780 | 674 |
| 22 | 181 | Salisbury | 4,300 | 64,128 | 671 |
| 23 | 183 | St Ives | 3,810 | 57,143 | 667 |
| 24 | 186 | Taunton Deane | 5,265 | 79,217 | 665 |
| 25 | 195 | Poole | 4,315 | 65,609 | 658 |
| 26 | 198 | North East Somerset | 4,145 | 63,202 | 656 |
| 27 | 207 | Mid Dorset and North Poole | 3,480 | 53,722 | 648 |
| 28 | 216 | South East Cornwall | 3,815 | 59,774 | 638 |
| 29 | 224 | Devizes | 4,370 | 69,251 | 631 |
| 30 | 228 | Tewkesbury | 4,595 | 73,257 | 627 |
| 31 | 242 | East Devon | 4,230 | 68,554 | 617 |
| 32 | 255 | Bridgwater and West Somerset | 4,480 | 75,183 | 596 |
| 33 | 258 | Chippenham | 3,915 | 66,100 | 592 |
| 34 | 274 | South West Wiltshire | 3,970 | 68,326 | 581 |
| 35 | 282 | Bath | 4,175 | 72,377 | 577 |
| 36 | 315 | St Austell and Newquay | 3,930 | 71,538 | 549 |
| 37 | 332 | Bournemouth West | 3,970 | 74,415 | 533 |
| 38 | 338 | Newton Abbot | 3,240 | 61,343 | 528 |
| 39 | 344 | Yeovil | 3,845 | 73,312 | 524 |
| 40 | 355 | Weston-Super-Mare | 3,790 | 74,045 | 512 |
| 41 | 365 | South West Devon | 2,940 | 58,777 | 500 |
| 42 | 371 | Bristol North West | 3,550 | 71,442 | 497 |
| 43 | 374 | South Swindon | 3,765 | 76,166 | 494 |
| 44 | 388 | Camborne and Redruth | 3,025 | 62,601 | 483 |
| 45 | 401 | Filton and Bradley Stoke | 3,520 | 74,048 | 475 |
| 46 | 408 | South Dorset | 2,930 | 62,335 | 470 |
| 47 | 412 | North Swindon | 3,600 | 76,679 | 469 |
| 48 | 426 | Bournemouth East | 3,370 | 73,222 | 460 |
| 49 | 456 | Torbay | 2,880 | 65,730 | 438 |
| 50 | 464 | Kingswood | 2,705 | 62,206 | 435 |
| 51 | 487 | Bristol South | 3,345 | 79,377 | 421 |
| 52 | 493 | Gloucester | 3,415 | 82,193 | 415 |
| 53 | 495 | Exeter | 3,575 | 86,520 | 413 |
| 54 | 505 | Bristol East | 2,890 | 71,109 | 406 |
| 55 | 561 | Plymouth - Sutton and Devonport | 3,025 | 84,249 | 359 |
| 56 | 646 | Plymouth - Moor View | 1,495 | 61,868 | 242 |
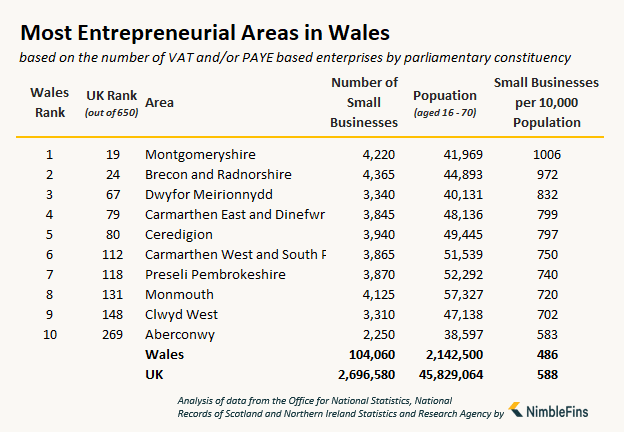
Most Entrepreneurial Areas in Wales
The data showed that Wales ranked 10th out of the 12 in the UK for the rate of entrepreneurship, with 104,060 small businesses yielding a rate of 486 small businesses per 10K working-age people.
Two parliamentary constituencies in Wales made the UK Top 50 list: Montgomeryshire and Brecon & Radnorshire. With 4,220 small businesses in 2019, Montgomeryshire sported a rate of 1,006 small businesses per 10K working people.
| Wales Rank | UK Rank | Local Authority | Number Small Businesses (0-49 employees) | Working Population (aged 16 to 70) | Small Businesses per 10,000 Working Population |
|---|---|---|---|---|---|
| 1 | 19 | Montgomeryshire | 4,220 | 41,969 | 1,006 |
| 2 | 24 | Brecon and Radnorshire | 4,365 | 44,893 | 972 |
| 3 | 67 | Dwyfor Meirionnydd | 3,340 | 40,131 | 832 |
| 4 | 79 | Carmarthen East and Dinefwr | 3,845 | 48,136 | 799 |
| 5 | 80 | Ceredigion | 3,940 | 49,445 | 797 |
| 6 | 112 | Carmarthen West and South Pembrokeshire | 3,865 | 51,539 | 750 |
| 7 | 118 | Preseli Pembrokeshire | 3,870 | 52,292 | 740 |
| 8 | 131 | Monmouth | 4,125 | 57,327 | 720 |
| 9 | 148 | Clwyd West | 3,310 | 47,138 | 702 |
| 10 | 269 | Aberconwy | 2,250 | 38,597 | 583 |
| 11 | 292 | Gower | 3,000 | 52,810 | 568 |
| 12 | 309 | Ynys Môn | 2,525 | 45,638 | 553 |
| 13 | 333 | Delyn | 2,495 | 46,818 | 533 |
| 14 | 352 | Vale of Clwyd | 2,445 | 47,477 | 515 |
| 15 | 376 | Newport West | 2,980 | 60,697 | 491 |
| 16 | 386 | Alyn and Deeside | 2,825 | 58,375 | 484 |
| 17 | 402 | Cardiff South and Penarth | 3,960 | 83,339 | 475 |
| 18 | 410 | Pontypridd | 2,690 | 57,260 | 470 |
| 19 | 413 | Clwyd South | 2,275 | 48,549 | 469 |
| 20 | 432 | Wrexham | 2,195 | 48,203 | 455 |
| 21 | 438 | Vale of Glamorgan | 3,165 | 69,946 | 452 |
| 22 | 474 | Bridgend | 2,490 | 58,417 | 426 |
| 23 | 477 | Arfon | 1,880 | 44,255 | 425 |
| 24 | 479 | Cardiff Central | 3,120 | 73,630 | 424 |
| 25 | 504 | Cardiff West | 2,635 | 64,757 | 407 |
| 26 | 506 | Cardiff North | 2,565 | 63,129 | 406 |
| 27 | 563 | Swansea West | 2,155 | 60,748 | 355 |
| 28 | 566 | Newport East | 1,990 | 56,225 | 354 |
| 29 | 567 | Llanelli | 1,970 | 55,855 | 353 |
| 30 | 581 | Caerphilly | 2,050 | 60,309 | 340 |
| 31 | 583 | Torfaen | 1,940 | 57,247 | 339 |
| 32 | 591 | Islwyn | 1,750 | 52,494 | 333 |
| 33 | 607 | Ogmore | 1,735 | 54,538 | 318 |
| 34 | 611 | Neath | 1,600 | 51,031 | 314 |
| 35 | 618 | Swansea East | 1,800 | 58,595 | 307 |
| 36 | 623 | Merthyr Tydfil and Rhymney | 1,540 | 52,573 | 293 |
| 37 | 624 | Cynon Valley | 1,425 | 48,664 | 293 |
| 38 | 628 | Aberavon | 1,345 | 47,518 | 283 |
| 39 | 642 | Rhondda | 1,190 | 47,380 | 251 |
| 40 | 644 | Blaenau Gwent | 1,195 | 48,214 | 248 |
Most Entrepreneurial Areas in the West Midlands
West Midlands has the 7th highest (out of 12) number of small businesses per person. In 2019 there were 217,535 small businesses in the region, yielding a rate of 540 small businesses peer 10,000 working-age people. Seven parliamentary constituencies in West Midlands ranked in the top 50 in the UK.
In fact, three parliamentary constituencies in the West Midlands have more than 1,000 small businesses per 10K working people: Bromsgrove, Birmingham - Ladywood and Stratford-on-Avon.

| West Midlands Rank | UK Rank | Local Authority | Number Small Businesses (0-49 employees) | Working Population (aged 16 to 70) | Small Businesses per 10,000 Working Population |
|---|---|---|---|---|---|
| 1 | 4 | Bromsgrove | 9,090 | 65,878 | 1,380 |
| 2 | 5 | Birmingham - Ladywood | 13,055 | 109,961 | 1,187 |
| 3 | 14 | Stratford-on-Avon | 6,410 | 62,111 | 1,032 |
| 4 | 33 | North Herefordshire | 5,630 | 59,721 | 943 |
| 5 | 38 | Kenilworth and Southam | 5,285 | 56,851 | 930 |
| 6 | 42 | Ludlow | 5,190 | 56,478 | 919 |
| 7 | 47 | West Worcestershire | 5,680 | 62,414 | 910 |
| 8 | 134 | Mid Worcestershire | 5,010 | 69,972 | 716 |
| 9 | 144 | Warwick and Leamington | 5,130 | 72,890 | 704 |
| 10 | 159 | Stone | 3,995 | 57,996 | 689 |
| 11 | 167 | North Shropshire | 5,090 | 74,842 | 680 |
| 12 | 189 | Hereford and South Herefordshire | 4,550 | 68,735 | 662 |
| 13 | 190 | Rugby | 4,610 | 69,665 | 662 |
| 14 | 192 | Wyre Forest | 4,395 | 66,564 | 660 |
| 15 | 196 | Lichfield | 4,185 | 63,743 | 657 |
| 16 | 211 | Staffordshire Moorlands | 3,385 | 52,674 | 643 |
| 17 | 214 | Shrewsbury and Atcham | 4,715 | 73,597 | 641 |
| 18 | 239 | Sutton Coldfield | 3,805 | 61,488 | 619 |
| 19 | 262 | Redditch | 3,670 | 62,027 | 592 |
| 20 | 286 | Meriden | 4,275 | 74,523 | 574 |
| 21 | 288 | Dudley South | 3,080 | 53,906 | 571 |
| 22 | 291 | Solihull | 3,830 | 67,366 | 569 |
| 23 | 297 | South Staffordshire | 3,720 | 65,924 | 564 |
| 24 | 317 | North Warwickshire | 3,460 | 63,288 | 547 |
| 25 | 322 | Tamworth | 3,540 | 65,022 | 544 |
| 26 | 326 | Burton | 3,965 | 73,622 | 539 |
| 27 | 362 | Stafford | 3,410 | 67,749 | 503 |
| 28 | 385 | Cannock Chase | 3,380 | 69,793 | 484 |
| 29 | 390 | Aldridge-Brownhills | 2,455 | 50,851 | 483 |
| 30 | 407 | Wolverhampton South West | 2,855 | 60,527 | 472 |
| 31 | 421 | Telford | 3,115 | 67,404 | 462 |
| 32 | 433 | Stourbridge | 2,770 | 60,843 | 455 |
| 33 | 434 | Halesowen and Rowley Regis | 2,705 | 59,503 | 455 |
| 34 | 452 | Birmingham - Hall Green | 3,620 | 81,757 | 443 |
| 35 | 453 | Worcester | 3,125 | 70,825 | 441 |
| 36 | 454 | The Wrekin | 2,920 | 66,334 | 440 |
| 37 | 466 | Nuneaton | 2,820 | 65,006 | 434 |
| 38 | 471 | Wolverhampton South East | 2,700 | 63,106 | 428 |
| 39 | 485 | West Bromwich West | 2,765 | 65,446 | 422 |
| 40 | 488 | Walsall South | 2,990 | 71,080 | 421 |
| 41 | 508 | Coventry South | 3,955 | 97,527 | 406 |
| 42 | 521 | Birmingham - Edgbaston | 2,980 | 75,383 | 395 |
| 43 | 528 | Warley | 2,595 | 66,798 | 388 |
| 44 | 536 | West Bromwich East | 2,395 | 62,826 | 381 |
| 45 | 540 | Birmingham - Perry Barr | 2,880 | 76,662 | 376 |
| 46 | 545 | Coventry North East | 3,300 | 88,717 | 372 |
| 47 | 548 | Stoke-on-Trent Central | 2,285 | 61,623 | 371 |
| 48 | 549 | Birmingham - Yardley | 2,775 | 74,944 | 370 |
| 49 | 556 | Newcastle-under-Lyme | 2,425 | 66,511 | 365 |
| 50 | 560 | Dudley North | 2,055 | 57,034 | 360 |
| 51 | 582 | Birmingham - Erdington | 2,400 | 70,793 | 339 |
| 52 | 587 | Stoke-on-Trent North | 2,260 | 67,012 | 337 |
| 53 | 589 | Coventry North West | 2,645 | 78,719 | 336 |
| 54 | 592 | Walsall North | 2,220 | 67,052 | 331 |
| 55 | 604 | Stoke-on-Trent South | 1,915 | 60,056 | 319 |
| 56 | 609 | Wolverhampton North East | 1,955 | 61,713 | 317 |
| 57 | 636 | Birmingham - Selly Oak | 2,135 | 80,491 | 265 |
| 58 | 637 | Birmingham - Northfield | 1,805 | 68,430 | 264 |
| 59 | 638 | Birmingham - Hodge Hill | 2,175 | 82,752 | 263 |
Most Entrepreneurial Areas in Yorkshire and the Humber
Yorkshire and the Humber has the 9th highest (out of 12) number of small businesses per person. In 2019 there were 185,205 small businesses in the region, yielding a rate of 492 small businesses peer 10,000 working-age people. Two parliamentary constituencies in Yorkshire and the Humber ranked in the top 50 in the UK.
In Yorkshire and the Humber, Skipton and Ripon has the highest rate of entrepreneurship, with 981 small businesses per 10K working people, which ranks 22nd out of 649 parliamentary constituencies in the UK. The second best local area is Thirsk and Malton, with a rate of 934 small businesses per 10K working people which ranked 36th in the UK.

| Yorkshire Humber Rank | UK Rank | Local Authority | Number Small Businesses (0-49 employees) | Working Population (aged 16 to 70) | Small Businesses per 10,000 Working Population |
|---|---|---|---|---|---|
| 1 | 22 | Skipton and Ripon | 6,445 | 65,718 | 981 |
| 2 | 36 | Thirsk and Malton | 6,295 | 67,369 | 934 |
| 3 | 82 | Richmond (Yorks) | 5,870 | 74,141 | 792 |
| 4 | 129 | Harrogate and Knaresborough | 4,940 | 68,507 | 721 |
| 5 | 165 | Selby and Ainsty | 4,855 | 71,261 | 681 |
| 6 | 172 | Calder Valley | 4,885 | 72,185 | 677 |
| 7 | 178 | Elmet and Rothwell | 4,380 | 65,205 | 672 |
| 8 | 202 | East Yorkshire | 4,335 | 66,653 | 650 |
| 9 | 206 | Leeds East | 4,335 | 66,914 | 648 |
| 10 | 215 | Haltemprice and Howden | 3,805 | 59,464 | 640 |
| 11 | 250 | York Outer | 3,890 | 64,568 | 602 |
| 12 | 277 | Beverley and Holderness | 3,850 | 66,398 | 580 |
| 13 | 284 | Scarborough and Whitby | 3,675 | 63,944 | 575 |
| 14 | 299 | Pudsey | 3,470 | 61,612 | 563 |
| 15 | 306 | Leeds Central | 6,695 | 120,391 | 556 |
| 16 | 313 | Colne Valley | 4,185 | 75,969 | 551 |
| 17 | 319 | Keighley | 3,510 | 64,268 | 546 |
| 18 | 331 | Brigg and Goole | 3,200 | 59,938 | 534 |
| 19 | 350 | Kingston upon Hull West and Hessle | 3,175 | 61,460 | 517 |
| 20 | 356 | Shipley | 3,285 | 64,243 | 511 |
| 21 | 357 | Cleethorpes | 3,185 | 62,498 | 510 |
| 22 | 358 | Leeds North East | 3,225 | 63,491 | 508 |
| 23 | 359 | Wakefield | 3,515 | 69,257 | 508 |
| 24 | 372 | Dewsbury | 3,780 | 76,364 | 495 |
| 25 | 381 | Halifax | 3,490 | 71,808 | 486 |
| 26 | 396 | Penistone and Stocksbridge | 2,855 | 59,727 | 478 |
| 27 | 405 | Batley and Spen | 3,560 | 74,997 | 475 |
| 28 | 406 | Morley and Outwood | 3,270 | 69,280 | 472 |
| 29 | 415 | Huddersfield | 3,325 | 71,017 | 468 |
| 30 | 424 | Doncaster Central | 3,575 | 77,425 | 462 |
| 31 | 430 | Sheffield South East | 2,910 | 63,721 | 457 |
| 32 | 441 | Bradford West | 3,680 | 81,487 | 452 |
| 33 | 455 | Leeds North West | 2,800 | 63,761 | 439 |
| 34 | 458 | Don Valley | 2,970 | 67,983 | 437 |
| 35 | 470 | Sheffield Central | 4,800 | 112,176 | 428 |
| 36 | 476 | Sheffield - Hallam | 2,675 | 62,825 | 426 |
| 37 | 483 | Rother Valley | 2,730 | 64,524 | 423 |
| 38 | 514 | Barnsley Central | 2,575 | 64,029 | 402 |
| 39 | 524 | Wentworth and Dearne | 2,645 | 67,356 | 393 |
| 40 | 526 | Doncaster North | 2,615 | 66,694 | 392 |
| 41 | 534 | Bradford East | 3,015 | 78,575 | 384 |
| 42 | 537 | Great Grimsby | 2,265 | 59,600 | 380 |
| 43 | 546 | Rotherham | 2,335 | 62,878 | 371 |
| 44 | 553 | York Central | 3,160 | 86,424 | 366 |
| 45 | 559 | Scunthorpe | 2,260 | 62,392 | 362 |
| 46 | 562 | Normanton; Pontefract and Castleford | 2,820 | 78,584 | 359 |
| 47 | 584 | Hemsworth | 2,280 | 67,317 | 339 |
| 48 | 598 | Leeds West | 2,215 | 68,344 | 324 |
| 49 | 608 | Bradford South | 2,240 | 70,636 | 317 |
| 50 | 614 | Kingston upon Hull East | 1,890 | 61,154 | 309 |
| 51 | 615 | Barnsley East | 2,000 | 65,036 | 308 |
| 52 | 630 | Sheffield - Brightside and Hillsborough | 2,075 | 74,333 | 279 |
| 53 | 633 | Sheffield - Heeley | 1,800 | 64,907 | 277 |
| 54 | 649 | Kingston upon Hull North | 1,590 | 69,814 | 228 |
Methodology
To compare local areas of the United Kingdom to find the most entrepreneurial places, we analysed UK business data released on 29 September 2020 by the Office for National Statistics as well as the latest population data from the ONS, National Records of Scotland and the Northern Ireland Statistics and Research Agency.
Note: this data does not consider the number of very small businesses that are not registered for VAT or PAYE, such as self employed people with lower turnovers and no employees. This study looks at businesses with either £85,000 of turnover (the threshold for registering for VAT) and/or those employing at least one person (triggering PAYE registration).
We have excluded the City of London and Westminster from our analysis, as the data for this local authority was an outlier that lies an abnormal distance from other values in the sample. The rate for City of London and Westminster was 6,373 small businesses per 10,000 working age people (66,640 small businesses for 104,559 residents). This figure reflects the high number of registered offices in the city, and therefore does not reflect the spirit of this study.
Finally, the population figures we used reflect those of working age between the ages of 16 and 70.
Data by Parliamentary Constituency (Alphabetical Order)
| Regional Rank | UK Rank | Local Authority | Region | Number Small Businesses (0-49 employees) | Working Population (aged 16 to 70) | Small Businesses per 10,000 Working Population |
|---|---|---|---|---|---|---|
| 38 | 628 | Aberavon | Wales | 1,345 | 47,518 | 283 |
| 10 | 269 | Aberconwy | Wales | 2,250 | 38,597 | 583 |
| 48 | 617 | Aberdeen North | Scotland | 2,375 | 77,296 | 307 |
| 8 | 154 | Aberdeen South | Scotland | 4,865 | 70,272 | 692 |
| 47 | 616 | Airdrie and Shotts | Scotland | 1,885 | 61,338 | 307 |
| 64 | 360 | Aldershot | South East | 3,715 | 73,375 | 506 |
| 29 | 390 | Aldridge-Brownhills | West Midlands | 2,455 | 50,851 | 483 |
| 3 | 32 | Altrincham and Sale West | North West | 6,335 | 66,822 | 948 |
| 16 | 386 | Alyn and Deeside | Wales | 2,825 | 58,375 | 484 |
| 29 | 428 | Amber Valley | East Midlands | 2,905 | 63,190 | 460 |
| 17 | 335 | Angus | Scotland | 3,090 | 58,423 | 529 |
| 23 | 477 | Arfon | Wales | 1,880 | 44,255 | 425 |
| 12 | 210 | Argyll and Bute | Scotland | 3,745 | 58,248 | 643 |
| 8 | 34 | Arundel and South Downs | South East | 6,100 | 64,835 | 941 |
| 44 | 579 | Ashfield | East Midlands | 2,490 | 72,986 | 341 |
| 33 | 126 | Ashford | South East | 5,970 | 82,521 | 723 |
| 62 | 519 | Ashton-under-Lyne | North West | 2,540 | 63,773 | 398 |
| 55 | 281 | Aylesbury | South East | 4,945 | 85,659 | 577 |
| 25 | 462 | Ayr; Carrick and Cumnock | Scotland | 2,715 | 62,388 | 435 |
| 41 | 169 | Banbury | South East | 5,785 | 85,355 | 678 |
| 7 | 116 | Banff and Buchan | Scotland | 4,670 | 62,897 | 742 |
| 56 | 342 | Barking | London | 4,965 | 94,461 | 526 |
| 38 | 514 | Barnsley Central | Yorkshire and the Humber | 2,575 | 64,029 | 402 |
| 51 | 615 | Barnsley East | Yorkshire and the Humber | 2,000 | 65,036 | 308 |
| 31 | 354 | Barrow and Furness | North West | 3,005 | 58,567 | 513 |
| 16 | 157 | Basildon and Billericay | East of England | 4,445 | 64,394 | 690 |
| 58 | 310 | Basingstoke | South East | 4,425 | 80,011 | 553 |
| 30 | 429 | Bassetlaw | East Midlands | 3,320 | 72,620 | 457 |
| 35 | 282 | Bath | South West | 4,175 | 72,377 | 577 |
| 27 | 405 | Batley and Spen | Yorkshire and the Humber | 3,560 | 74,997 | 475 |
| 25 | 133 | Battersea | London | 6,715 | 93,741 | 716 |
| 1 | 8 | Beaconsfield | South East | 7,440 | 66,538 | 1,118 |
| 27 | 141 | Beckenham | London | 4,425 | 62,667 | 706 |
| 49 | 339 | Bedford | East of England | 3,835 | 72,617 | 528 |
| 15 | 533 | Belfast East | Northern Ireland | 2,550 | 66,193 | 385 |
| 17 | 569 | Belfast North | Northern Ireland | 2,480 | 70,868 | 350 |
| 8 | 311 | Belfast South | Northern Ireland | 4,735 | 85,711 | 552 |
| 18 | 641 | Belfast West | Northern Ireland | 1,620 | 64,129 | 253 |
| 13 | 53 | Bermondsey and Old Southwark | London | 10,300 | 118,511 | 869 |
| 13 | 223 | Berwickshire; Roxburgh and Selkirk | Scotland | 4,030 | 63,786 | 632 |
| 2 | 182 | Berwick-upon-Tweed | North East | 3,460 | 51,634 | 670 |
| 22 | 120 | Bethnal Green and Bow | London | 8,650 | 117,684 | 735 |
| 12 | 277 | Beverley and Holderness | Yorkshire and the Humber | 3,850 | 66,398 | 580 |
| 38 | 143 | Bexhill and Battle | South East | 4,745 | 67,238 | 706 |
| 63 | 378 | Bexleyheath and Crayford | London | 3,155 | 64,513 | 489 |
| 64 | 542 | Birkenhead | North West | 2,320 | 61,915 | 375 |
| 42 | 521 | Birmingham - Edgbaston | West Midlands | 2,980 | 75,383 | 395 |
| 51 | 582 | Birmingham - Erdington | West Midlands | 2,400 | 70,793 | 339 |
| 34 | 452 | Birmingham - Hall Green | West Midlands | 3,620 | 81,757 | 443 |
| 59 | 638 | Birmingham - Hodge Hill | West Midlands | 2,175 | 82,752 | 263 |
| 2 | 5 | Birmingham - Ladywood | West Midlands | 13,055 | 109,961 | 1,187 |
| 58 | 637 | Birmingham - Northfield | West Midlands | 1,805 | 68,430 | 264 |
| 45 | 540 | Birmingham - Perry Barr | West Midlands | 2,880 | 76,662 | 376 |
| 57 | 636 | Birmingham - Selly Oak | West Midlands | 2,135 | 80,491 | 265 |
| 48 | 549 | Birmingham - Yardley | West Midlands | 2,775 | 74,944 | 370 |
| 3 | 347 | Bishop Auckland | North East | 3,180 | 61,045 | 521 |
| 40 | 411 | Blackburn | North West | 3,465 | 73,772 | 470 |
| 22 | 295 | Blackley and Broughton | North West | 4,655 | 82,221 | 566 |
| 69 | 577 | Blackpool North and Cleveleys | North West | 1,895 | 55,035 | 344 |
| 48 | 448 | Blackpool South | North West | 2,405 | 54,054 | 445 |
| 40 | 644 | Blaenau Gwent | Wales | 1,195 | 48,214 | 248 |
| 8 | 497 | Blaydon | North East | 2,425 | 58,771 | 413 |
| 26 | 619 | Blyth Valley | North East | 1,780 | 57,990 | 307 |
| 74 | 445 | Bognor Regis and Littlehampton | South East | 3,130 | 70,018 | 447 |
| 39 | 511 | Bolsover | East Midlands | 2,790 | 68,917 | 405 |
| 19 | 276 | Bolton North East | North West | 3,855 | 66,384 | 581 |
| 41 | 416 | Bolton South East | North West | 3,340 | 71,352 | 468 |
| 32 | 369 | Bolton West | North West | 3,270 | 65,700 | 498 |
| 67 | 575 | Bootle | North West | 2,395 | 69,363 | 345 |
| 26 | 367 | Boston and Skegness | East Midlands | 3,585 | 71,864 | 499 |
| 12 | 220 | Bosworth | East Midlands | 4,565 | 71,853 | 635 |
| 48 | 426 | Bournemouth East | South West | 3,370 | 73,222 | 460 |
| 37 | 332 | Bournemouth West | South West | 3,970 | 74,415 | 533 |
| 60 | 327 | Bracknell | South East | 4,180 | 77,708 | 538 |
| 41 | 534 | Bradford East | Yorkshire and the Humber | 3,015 | 78,575 | 384 |
| 49 | 608 | Bradford South | Yorkshire and the Humber | 2,240 | 70,636 | 317 |
| 32 | 441 | Bradford West | Yorkshire and the Humber | 3,680 | 81,487 | 452 |
| 23 | 201 | Braintree | East of England | 4,445 | 68,134 | 652 |
| 2 | 24 | Brecon and Radnorshire | Wales | 4,365 | 44,893 | 972 |
| 40 | 232 | Brent Central | London | 6,610 | 106,091 | 623 |
| 28 | 145 | Brent North | London | 6,630 | 94,371 | 703 |
| 16 | 59 | Brentford and Isleworth | London | 8,200 | 97,003 | 845 |
| 4 | 44 | Brentwood and Ongar | East of England | 5,920 | 64,644 | 916 |
| 22 | 474 | Bridgend | Wales | 2,490 | 58,417 | 426 |
| 32 | 255 | Bridgwater and West Somerset | South West | 4,480 | 75,183 | 596 |
| 18 | 331 | Brigg and Goole | Yorkshire and the Humber | 3,200 | 59,938 | 534 |
| 77 | 502 | Brighton - Kemptown | South East | 2,855 | 69,973 | 408 |
| 12 | 52 | Brighton - Pavilion | South East | 7,860 | 89,767 | 876 |
| 54 | 505 | Bristol East | South West | 2,890 | 71,109 | 406 |
| 42 | 371 | Bristol North West | South West | 3,550 | 71,442 | 497 |
| 51 | 487 | Bristol South | South West | 3,345 | 79,377 | 421 |
| 13 | 121 | Bristol West | South West | 8,410 | 115,094 | 731 |
| 25 | 212 | Broadland | East of England | 4,195 | 65,284 | 643 |
| 23 | 128 | Bromley and Chislehurst | London | 4,695 | 65,108 | 721 |
| 1 | 4 | Bromsgrove | West Midlands | 9,090 | 65,878 | 1,380 |
| 20 | 180 | Broxbourne | East of England | 4,600 | 68,595 | 671 |
| 37 | 499 | Broxtowe | East Midlands | 2,795 | 67,822 | 412 |
| 6 | 25 | Buckingham | South East | 6,965 | 71,893 | 969 |
| 49 | 463 | Burnley | North West | 2,575 | 59,190 | 435 |
| 26 | 326 | Burton | West Midlands | 3,965 | 73,622 | 539 |
| 15 | 237 | Bury North | North West | 3,765 | 60,736 | 620 |
| 16 | 245 | Bury South | North West | 4,155 | 67,855 | 612 |
| 38 | 275 | Bury St Edmunds | East of England | 4,600 | 79,200 | 581 |
| 30 | 581 | Caerphilly | Wales | 2,050 | 60,309 | 340 |
| 6 | 95 | Caithness; Sutherland and Easter Ross | Scotland | 3,160 | 40,763 | 775 |
| 6 | 172 | Calder Valley | Yorkshire and the Humber | 4,885 | 72,185 | 677 |
| 70 | 468 | Camberwell and Peckham | London | 4,155 | 96,810 | 429 |
| 44 | 388 | Camborne and Redruth | South West | 3,025 | 62,601 | 483 |
| 47 | 336 | Cambridge | East of England | 4,525 | 85,593 | 529 |
| 28 | 385 | Cannock Chase | West Midlands | 3,380 | 69,793 | 484 |
| 73 | 440 | Canterbury | South East | 3,910 | 86,570 | 452 |
| 24 | 479 | Cardiff Central | Wales | 3,120 | 73,630 | 424 |
| 26 | 506 | Cardiff North | Wales | 2,565 | 63,129 | 406 |
| 17 | 402 | Cardiff South and Penarth | Wales | 3,960 | 83,339 | 475 |
| 25 | 504 | Cardiff West | Wales | 2,635 | 64,757 | 407 |
| 30 | 349 | Carlisle | North West | 3,045 | 58,916 | 517 |
| 4 | 79 | Carmarthen East and Dinefwr | Wales | 3,845 | 48,136 | 799 |
| 6 | 112 | Carmarthen West and South Pembrokeshire | Wales | 3,865 | 51,539 | 750 |
| 54 | 320 | Carshalton and Wallington | London | 3,860 | 70,734 | 546 |
| 40 | 293 | Castle Point | East of England | 3,350 | 58,980 | 568 |
| 35 | 550 | Central Ayrshire | Scotland | 2,185 | 59,216 | 369 |
| 2 | 40 | Central Devon | South West | 5,725 | 61,954 | 924 |
| 19 | 170 | Central Suffolk and North Ipswich | East of England | 4,560 | 67,286 | 678 |
| 5 | 80 | Ceredigion | Wales | 3,940 | 49,445 | 797 |
| 23 | 300 | Charnwood | East Midlands | 3,915 | 70,009 | 559 |
| 76 | 460 | Chatham and Aylesford | South East | 3,055 | 70,121 | 436 |
| 12 | 153 | Cheadle | North West | 4,280 | 61,382 | 697 |
| 35 | 257 | Chelmsford | East of England | 4,550 | 76,777 | 593 |
| 6 | 11 | Chelsea and Fulham | London | 8,590 | 79,734 | 1,077 |
| 21 | 176 | Cheltenham | South West | 4,905 | 72,780 | 674 |
| 4 | 16 | Chesham and Amersham | South East | 6,295 | 61,346 | 1,026 |
| 31 | 436 | Chesterfield | East Midlands | 2,950 | 64,936 | 454 |
| 17 | 74 | Chichester | South East | 5,840 | 71,739 | 814 |
| 33 | 173 | Chingford and Woodford Green | London | 4,335 | 64,093 | 676 |
| 33 | 258 | Chippenham | South West | 3,915 | 66,100 | 592 |
| 19 | 81 | Chipping Barnet | London | 6,420 | 81,077 | 792 |
| 29 | 346 | Chorley | North West | 3,735 | 71,564 | 522 |
| 18 | 149 | Christchurch | South West | 3,710 | 52,859 | 702 |
| 14 | 197 | City of Chester | North West | 4,415 | 67,301 | 656 |
| 20 | 594 | City of Durham | North East | 2,535 | 77,048 | 329 |
| 57 | 517 | Clacton | East of England | 2,220 | 55,495 | 400 |
| 21 | 357 | Cleethorpes | Yorkshire and the Humber | 3,185 | 62,498 | 510 |
| 19 | 413 | Clwyd South | Wales | 2,275 | 48,549 | 469 |
| 9 | 148 | Clwyd West | Wales | 3,310 | 47,138 | 702 |
| 41 | 590 | Coatbridge; Chryston and Bellshill | Scotland | 2,260 | 67,764 | 334 |
| 53 | 439 | Colchester | East of England | 3,985 | 88,072 | 452 |
| 16 | 313 | Colne Valley | Yorkshire and the Humber | 4,185 | 75,969 | 551 |
| 11 | 151 | Congleton | North West | 4,455 | 63,874 | 697 |
| 20 | 278 | Copeland | North West | 3,080 | 53,128 | 580 |
| 13 | 222 | Corby | East Midlands | 5,365 | 84,877 | 632 |
| 46 | 545 | Coventry North East | West Midlands | 3,300 | 88,717 | 372 |
| 53 | 589 | Coventry North West | West Midlands | 2,645 | 78,719 | 336 |
| 41 | 508 | Coventry South | West Midlands | 3,955 | 97,527 | 406 |
| 75 | 459 | Crawley | South East | 3,385 | 77,695 | 436 |
| 36 | 394 | Crewe and Nantwich | North West | 3,620 | 75,543 | 479 |
| 52 | 308 | Croydon Central | London | 4,670 | 84,332 | 554 |
| 59 | 364 | Croydon North | London | 5,135 | 102,315 | 502 |
| 29 | 160 | Croydon South | London | 5,465 | 79,478 | 688 |
| 51 | 622 | Cumbernauld; Kilsyth and Kirkintilloch East | Scotland | 1,850 | 61,317 | 302 |
| 37 | 624 | Cynon Valley | Wales | 1,425 | 48,664 | 293 |
| 62 | 377 | Dagenham and Rainham | London | 3,665 | 74,934 | 489 |
| 10 | 520 | Darlington | North East | 2,470 | 62,054 | 398 |
| 49 | 227 | Dartford | South East | 5,025 | 80,101 | 627 |
| 4 | 85 | Daventry | East Midlands | 5,485 | 69,391 | 790 |
| 13 | 333 | Delyn | Wales | 2,495 | 46,818 | 533 |
| 52 | 478 | Denton and Reddish | North West | 2,545 | 60,010 | 424 |
| 38 | 503 | Derby North | East Midlands | 2,875 | 70,611 | 407 |
| 35 | 482 | Derby South | East Midlands | 3,330 | 78,683 | 423 |
| 1 | 27 | Derbyshire Dales | East Midlands | 5,180 | 54,008 | 959 |
| 29 | 224 | Devizes | South West | 4,370 | 69,251 | 631 |
| 24 | 372 | Dewsbury | Yorkshire and the Humber | 3,780 | 76,364 | 495 |
| 34 | 458 | Don Valley | Yorkshire and the Humber | 2,970 | 67,983 | 437 |
| 30 | 424 | Doncaster Central | Yorkshire and the Humber | 3,575 | 77,425 | 462 |
| 40 | 526 | Doncaster North | Yorkshire and the Humber | 2,615 | 66,694 | 392 |
| 79 | 531 | Dover | South East | 2,675 | 69,222 | 386 |
| 50 | 560 | Dudley North | West Midlands | 2,055 | 57,034 | 360 |
| 21 | 288 | Dudley South | West Midlands | 3,080 | 53,906 | 571 |
| 45 | 244 | Dulwich and West Norwood | London | 5,145 | 83,737 | 614 |
| 14 | 253 | Dumfries and Galloway | Scotland | 3,855 | 64,304 | 599 |
| 10 | 179 | Dumfriesshire; Clydesdale and Tweeddale | Scotland | 3,890 | 58,002 | 671 |
| 45 | 603 | Dundee East | Scotland | 1,970 | 61,739 | 319 |
| 46 | 605 | Dundee West | Scotland | 2,100 | 65,908 | 319 |
| 38 | 568 | Dunfermline and West Fife | Scotland | 2,505 | 71,315 | 351 |
| 3 | 67 | Dwyfor Meirionnydd | Wales | 3,340 | 40,131 | 832 |
| 41 | 233 | Ealing - Southall | London | 4,215 | 67,675 | 623 |
| 8 | 23 | Ealing Central and Acton | London | 8,790 | 90,064 | 976 |
| 46 | 259 | Ealing North | London | 4,790 | 80,884 | 592 |
| 27 | 627 | Easington | North East | 1,605 | 56,375 | 285 |
| 13 | 515 | East Antrim | Northern Ireland | 2,510 | 62,466 | 402 |
| 31 | 242 | East Devon | South West | 4,230 | 68,554 | 617 |
| 23 | 449 | East Dunbartonshire | Scotland | 2,480 | 55,759 | 445 |
| 65 | 391 | East Ham | London | 5,595 | 116,168 | 482 |
| 14 | 65 | East Hampshire | South East | 5,495 | 65,862 | 834 |
| 33 | 538 | East Kilbride; Strathaven and Lesmahagow | Scotland | 2,745 | 72,423 | 379 |
| 7 | 271 | East Londonderry | Northern Ireland | 4,070 | 69,944 | 582 |
| 24 | 457 | East Lothian | Scotland | 3,185 | 72,855 | 437 |
| 28 | 491 | East Renfrewshire | Scotland | 2,625 | 62,971 | 417 |
| 21 | 86 | East Surrey | South East | 5,970 | 75,608 | 790 |
| 63 | 345 | East Worthing and Shoreham | South East | 3,455 | 65,967 | 524 |
| 8 | 202 | East Yorkshire | Yorkshire and the Humber | 4,335 | 66,653 | 650 |
| 71 | 422 | Eastbourne | South East | 3,320 | 71,847 | 462 |
| 34 | 135 | Eastleigh | South East | 5,470 | 76,416 | 716 |
| 7 | 93 | Eddisbury | North West | 4,725 | 60,581 | 780 |
| 34 | 541 | Edinburgh East | Scotland | 3,235 | 86,163 | 375 |
| 4 | 90 | Edinburgh North and Leith | Scotland | 7,040 | 90,108 | 781 |
| 36 | 554 | Edinburgh South | Scotland | 2,430 | 66,473 | 366 |
| 29 | 512 | Edinburgh South West | Scotland | 3,245 | 80,209 | 405 |
| 27 | 486 | Edinburgh West | Scotland | 2,970 | 70,458 | 422 |
| 68 | 397 | Edmonton | London | 3,905 | 81,714 | 478 |
| 60 | 510 | Ellesmere Port and Neston | North West | 2,400 | 59,278 | 405 |
| 7 | 178 | Elmet and Rothwell | Yorkshire and the Humber | 4,380 | 65,205 | 672 |
| 61 | 373 | Eltham | London | 3,250 | 65,707 | 495 |
| 15 | 58 | Enfield - Southgate | London | 6,140 | 72,304 | 849 |
| 60 | 370 | Enfield North | London | 3,665 | 73,715 | 497 |
| 7 | 64 | Epping Forest | East of England | 5,720 | 68,125 | 840 |
| 39 | 146 | Epsom and Ewell | South East | 5,160 | 73,456 | 702 |
| 33 | 443 | Erewash | East Midlands | 2,985 | 66,448 | 449 |
| 71 | 481 | Erith and Thamesmead | London | 3,580 | 84,582 | 423 |
| 9 | 43 | Esher and Walton | South East | 6,795 | 73,966 | 919 |
| 53 | 495 | Exeter | South West | 3,575 | 86,520 | 413 |
| 44 | 597 | Falkirk | Scotland | 2,570 | 79,087 | 325 |
| 52 | 263 | Fareham | South East | 4,050 | 68,470 | 591 |
| 46 | 194 | Faversham and Mid Kent | South East | 4,380 | 66,581 | 658 |
| 57 | 343 | Feltham and Heston | London | 4,930 | 93,811 | 526 |
| 1 | 21 | Fermanagh and South Tyrone | Northern Ireland | 7,175 | 73,139 | 981 |
| 45 | 401 | Filton and Bradley Stoke | South West | 3,520 | 74,048 | 475 |
| 5 | 7 | Finchley and Golders Green | London | 10,565 | 92,284 | 1,145 |
| 61 | 328 | Folkestone and Hythe | South East | 4,205 | 78,246 | 537 |
| 16 | 136 | Forest of Dean | South West | 4,375 | 61,351 | 713 |
| 16 | 564 | Foyle | Northern Ireland | 2,535 | 71,590 | 354 |
| 17 | 252 | Fylde | North West | 3,415 | 56,943 | 600 |
| 20 | 266 | Gainsborough | East Midlands | 3,830 | 65,024 | 589 |
| 37 | 398 | Garston and Halewood | North West | 3,240 | 67,835 | 478 |
| 12 | 552 | Gateshead | North East | 2,560 | 69,561 | 368 |
| 41 | 522 | Gedling | East Midlands | 2,575 | 65,453 | 393 |
| 80 | 543 | Gillingham and Rainham | South East | 2,610 | 69,699 | 374 |
| 2 | 31 | Glasgow Central | Scotland | 8,225 | 86,541 | 950 |
| 56 | 632 | Glasgow East | Scotland | 1,900 | 68,493 | 277 |
| 42 | 595 | Glasgow North | Scotland | 2,105 | 64,339 | 327 |
| 59 | 647 | Glasgow North East | Scotland | 1,540 | 64,718 | 238 |
| 58 | 645 | Glasgow North West | Scotland | 1,585 | 64,882 | 244 |
| 52 | 625 | Glasgow South | Scotland | 1,915 | 65,734 | 291 |
| 57 | 643 | Glasgow South West | Scotland | 1,585 | 63,246 | 251 |
| 55 | 631 | Glenrothes | Scotland | 1,675 | 60,258 | 278 |
| 52 | 493 | Gloucester | South West | 3,415 | 82,193 | 415 |
| 9 | 164 | Gordon | Scotland | 4,920 | 72,111 | 682 |
| 82 | 571 | Gosport | South East | 2,320 | 66,383 | 349 |
| 11 | 292 | Gower | Wales | 3,000 | 52,810 | 568 |
| 18 | 260 | Grantham and Stamford | East Midlands | 4,390 | 74,165 | 592 |
| 56 | 302 | Gravesham | South East | 3,985 | 71,345 | 559 |
| 42 | 537 | Great Grimsby | Yorkshire and the Humber | 2,265 | 59,600 | 380 |
| 55 | 475 | Great Yarmouth | East of England | 2,770 | 64,995 | 426 |
| 51 | 289 | Greenwich and Woolwich | London | 5,595 | 98,349 | 569 |
| 43 | 188 | Guildford | South East | 5,490 | 82,729 | 664 |
| 26 | 140 | Hackney North and Stoke Newington | London | 7,320 | 103,559 | 707 |
| 3 | 3 | Hackney South and Shoreditch | London | 14,710 | 106,026 | 1,387 |
| 33 | 434 | Halesowen and Rowley Regis | West Midlands | 2,705 | 59,503 | 455 |
| 25 | 381 | Halifax | Yorkshire and the Humber | 3,490 | 71,808 | 486 |
| 10 | 215 | Haltemprice and Howden | Yorkshire and the Humber | 3,805 | 59,464 | 640 |
| 63 | 535 | Halton | North West | 2,580 | 67,624 | 382 |
| 18 | 71 | Hammersmith | London | 7,315 | 89,068 | 821 |
| 17 | 62 | Hampstead and Kilburn | London | 9,220 | 109,278 | 844 |
| 8 | 177 | Harborough | East Midlands | 4,790 | 71,102 | 674 |
| 31 | 240 | Harlow | East of England | 4,045 | 65,469 | 618 |
| 4 | 129 | Harrogate and Knaresborough | Yorkshire and the Humber | 4,940 | 68,507 | 721 |
| 12 | 51 | Harrow East | London | 6,540 | 73,523 | 890 |
| 14 | 57 | Harrow West | London | 6,565 | 77,088 | 852 |
| 14 | 565 | Hartlepool | North East | 2,255 | 63,707 | 354 |
| 24 | 209 | Harwich and North Essex | East of England | 4,195 | 64,878 | 647 |
| 65 | 368 | Hastings and Rye | South East | 3,735 | 75,017 | 498 |
| 69 | 417 | Havant | South East | 2,960 | 63,521 | 466 |
| 58 | 348 | Hayes and Harlington | London | 4,610 | 88,539 | 521 |
| 23 | 301 | Hazel Grove | North West | 2,900 | 51,861 | 559 |
| 21 | 184 | Hemel Hempstead | East of England | 4,875 | 73,227 | 666 |
| 47 | 584 | Hemsworth | Yorkshire and the Humber | 2,280 | 67,317 | 339 |
| 21 | 115 | Hendon | London | 7,385 | 99,343 | 743 |
| 2 | 12 | Henley | South East | 6,825 | 65,479 | 1,042 |
| 12 | 189 | Hereford and South Herefordshire | West Midlands | 4,550 | 68,735 | 662 |
| 8 | 69 | Hertford and Stortford | East of England | 6,555 | 78,953 | 830 |
| 1 | 9 | Hertsmere | East of England | 7,480 | 69,085 | 1,083 |
| 1 | 102 | Hexham | North East | 3,940 | 51,302 | 768 |
| 45 | 435 | Heywood and Middleton | North West | 3,355 | 73,818 | 454 |
| 14 | 235 | High Peak | East Midlands | 3,980 | 63,945 | 622 |
| 6 | 63 | Hitchin and Harpenden | East of England | 5,760 | 68,466 | 841 |
| 1 | 1 | Holborn and St Pancras | London | 25,350 | 124,748 | 2,032 |
| 38 | 230 | Hornchurch and Upminster | London | 4,670 | 74,529 | 627 |
| 20 | 107 | Hornsey and Wood Green | London | 7,125 | 93,484 | 762 |
| 35 | 138 | Horsham | South East | 5,495 | 77,510 | 709 |
| 29 | 639 | Houghton and Sunderland South | North East | 1,550 | 60,503 | 256 |
| 31 | 117 | Hove | South East | 5,600 | 75,463 | 742 |
| 29 | 415 | Huddersfield | Yorkshire and the Humber | 3,325 | 71,017 | 468 |
| 26 | 213 | Huntingdon | East of England | 5,260 | 81,913 | 642 |
| 50 | 465 | Hyndburn | North West | 2,705 | 62,244 | 435 |
| 35 | 185 | Ilford North | London | 5,150 | 77,383 | 666 |
| 32 | 168 | Ilford South | London | 6,840 | 100,580 | 680 |
| 53 | 626 | Inverclyde | Scotland | 1,570 | 54,304 | 289 |
| 18 | 353 | Inverness; Nairn; Badenoch and Strathspey | Scotland | 3,790 | 73,631 | 515 |
| 54 | 451 | Ipswich | East of England | 3,450 | 77,908 | 443 |
| 68 | 389 | Isle of Wight | South East | 4,455 | 92,277 | 483 |
| 50 | 287 | Islington North | London | 5,215 | 90,924 | 574 |
| 2 | 2 | Islington South and Finsbury | London | 15,445 | 99,333 | 1,555 |
| 32 | 591 | Islwyn | Wales | 1,750 | 52,494 | 333 |
| 18 | 585 | Jarrow | North East | 1,935 | 57,291 | 338 |
| 17 | 319 | Keighley | Yorkshire and the Humber | 3,510 | 64,268 | 546 |
| 5 | 38 | Kenilworth and Southam | West Midlands | 5,285 | 56,851 | 930 |
| 4 | 6 | Kensington | London | 9,760 | 82,501 | 1,183 |
| 17 | 256 | Kettering | East Midlands | 4,050 | 68,212 | 594 |
| 32 | 530 | Kilmarnock and Loudoun | Scotland | 2,620 | 67,698 | 387 |
| 24 | 132 | Kingston and Surbiton | London | 6,565 | 91,314 | 719 |
| 50 | 614 | Kingston upon Hull East | Yorkshire and the Humber | 1,890 | 61,154 | 309 |
| 54 | 649 | Kingston upon Hull North | Yorkshire and the Humber | 1,590 | 69,814 | 228 |
| 19 | 350 | Kingston upon Hull West and Hessle | Yorkshire and the Humber | 3,175 | 61,460 | 517 |
| 50 | 464 | Kingswood | South West | 2,705 | 62,206 | 435 |
| 26 | 469 | Kirkcaldy and Cowdenbeath | Scotland | 2,890 | 67,399 | 429 |
| 68 | 576 | Knowsley | North West | 2,545 | 73,801 | 345 |
| 9 | 314 | Lagan Valley | Northern Ireland | 4,075 | 74,001 | 551 |
| 21 | 409 | Lanark and Hamilton East | Scotland | 3,210 | 68,316 | 470 |
| 43 | 425 | Lancaster and Fleetwood | North West | 3,075 | 66,730 | 461 |
| 15 | 306 | Leeds Central | Yorkshire and the Humber | 6,695 | 120,391 | 556 |
| 9 | 206 | Leeds East | Yorkshire and the Humber | 4,335 | 66,914 | 648 |
| 22 | 358 | Leeds North East | Yorkshire and the Humber | 3,225 | 63,491 | 508 |
| 33 | 455 | Leeds North West | Yorkshire and the Humber | 2,800 | 63,761 | 439 |
| 48 | 598 | Leeds West | Yorkshire and the Humber | 2,215 | 68,344 | 324 |
| 24 | 340 | Leicester East | East Midlands | 4,175 | 79,245 | 527 |
| 15 | 238 | Leicester South | East Midlands | 5,895 | 95,258 | 619 |
| 42 | 539 | Leicester West | East Midlands | 2,890 | 76,438 | 378 |
| 54 | 489 | Leigh | North West | 3,075 | 73,507 | 418 |
| 30 | 113 | Lewes | South East | 4,505 | 60,164 | 749 |
| 66 | 393 | Lewisham - Deptford | London | 4,705 | 98,181 | 479 |
| 72 | 484 | Lewisham East | London | 3,355 | 79,341 | 423 |
| 64 | 379 | Lewisham West and Penge | London | 4,070 | 83,528 | 487 |
| 39 | 231 | Leyton and Wanstead | London | 5,070 | 81,093 | 625 |
| 15 | 196 | Lichfield | West Midlands | 4,185 | 63,743 | 657 |
| 45 | 586 | Lincoln | East Midlands | 2,770 | 82,026 | 338 |
| 39 | 570 | Linlithgow and East Falkirk | Scotland | 2,900 | 82,976 | 349 |
| 27 | 329 | Liverpool - Riverside | North West | 6,025 | 112,396 | 536 |
| 74 | 635 | Liverpool - Walton | North West | 1,750 | 65,221 | 268 |
| 71 | 600 | Liverpool - Wavertree | North West | 2,190 | 68,160 | 321 |
| 75 | 648 | Liverpool - West Derby | North West | 1,495 | 64,207 | 233 |
| 40 | 573 | Livingston | Scotland | 2,745 | 79,019 | 347 |
| 29 | 567 | Llanelli | Wales | 1,970 | 55,855 | 353 |
| 32 | 442 | Loughborough | East Midlands | 3,660 | 81,423 | 450 |
| 16 | 251 | Louth and Horncastle | East Midlands | 3,905 | 64,821 | 602 |
| 6 | 42 | Ludlow | West Midlands | 5,190 | 56,478 | 919 |
| 56 | 500 | Luton North | East of England | 2,655 | 64,712 | 410 |
| 32 | 248 | Luton South | East of England | 4,990 | 82,633 | 604 |
| 8 | 105 | Macclesfield | North West | 4,730 | 61,856 | 765 |
| 11 | 49 | Maidenhead | South East | 6,405 | 70,796 | 905 |
| 45 | 193 | Maidstone and The Weald | South East | 4,900 | 74,408 | 659 |
| 70 | 578 | Makerfield | North West | 2,355 | 68,465 | 344 |
| 9 | 96 | Maldon | East of England | 4,780 | 61,712 | 775 |
| 73 | 613 | Manchester - Gorton | North West | 2,685 | 86,121 | 312 |
| 55 | 490 | Manchester - Withington | North West | 3,140 | 75,182 | 418 |
| 5 | 54 | Manchester Central | North West | 11,515 | 133,335 | 864 |
| 43 | 544 | Mansfield | East Midlands | 2,785 | 74,645 | 373 |
| 7 | 29 | Meon Valley | South East | 6,035 | 63,242 | 954 |
| 20 | 286 | Meriden | West Midlands | 4,275 | 74,523 | 574 |
| 36 | 623 | Merthyr Tydfil and Rhymney | Wales | 1,540 | 52,573 | 293 |
| 17 | 158 | Mid Bedfordshire | East of England | 5,375 | 77,878 | 690 |
| 28 | 400 | Mid Derbyshire | East Midlands | 2,640 | 55,534 | 475 |
| 27 | 207 | Mid Dorset and North Poole | South West | 3,480 | 53,722 | 648 |
| 36 | 264 | Mid Norfolk | East of England | 4,145 | 70,206 | 590 |
| 36 | 139 | Mid Sussex | South East | 5,385 | 76,065 | 708 |
| 3 | 50 | Mid Ulster | Northern Ireland | 6,280 | 70,356 | 893 |
| 8 | 134 | Mid Worcestershire | West Midlands | 5,010 | 69,972 | 716 |
| 13 | 557 | Middlesbrough | North East | 2,415 | 66,405 | 364 |
| 17 | 580 | Middlesbrough South and East Cleveland | North East | 2,125 | 62,372 | 341 |
| 31 | 529 | Midlothian | Scotland | 2,450 | 63,279 | 387 |
| 32 | 125 | Milton Keynes North | South East | 6,635 | 91,486 | 725 |
| 47 | 203 | Milton Keynes South | South East | 5,960 | 91,676 | 650 |
| 53 | 316 | Mitcham and Morden | London | 4,140 | 75,576 | 548 |
| 5 | 18 | Mole Valley | South East | 6,430 | 63,772 | 1,008 |
| 8 | 131 | Monmouth | Wales | 4,125 | 57,327 | 720 |
| 1 | 19 | Montgomeryshire | Wales | 4,220 | 41,969 | 1,006 |
| 19 | 383 | Moray | Scotland | 3,200 | 65,897 | 486 |
| 44 | 431 | Morecambe and Lunesdale | North West | 2,685 | 58,935 | 456 |
| 28 | 406 | Morley and Outwood | Yorkshire and the Humber | 3,270 | 69,280 | 472 |
| 54 | 629 | Motherwell and Wishaw | Scotland | 1,870 | 66,493 | 281 |
| 11 | 199 | Na h-Eileanan an Iar | Scotland | 1,170 | 17,861 | 655 |
| 34 | 611 | Neath | Wales | 1,600 | 51,031 | 314 |
| 53 | 272 | New Forest East | South East | 3,575 | 61,468 | 582 |
| 20 | 77 | New Forest West | South East | 4,245 | 52,862 | 803 |
| 6 | 147 | Newark | East Midlands | 4,950 | 70,483 | 702 |
| 13 | 56 | Newbury | South East | 6,435 | 75,340 | 854 |
| 5 | 461 | Newcastle upon Tyne Central | North East | 3,380 | 77,601 | 436 |
| 23 | 606 | Newcastle upon Tyne East | North East | 2,595 | 81,455 | 319 |
| 19 | 588 | Newcastle upon Tyne North | North East | 2,085 | 61,901 | 337 |
| 49 | 556 | Newcastle-under-Lyme | West Midlands | 2,425 | 66,511 | 365 |
| 28 | 566 | Newport East | Wales | 1,990 | 56,225 | 354 |
| 15 | 376 | Newport West | Wales | 2,980 | 60,697 | 491 |
| 4 | 91 | Newry and Armagh | Northern Ireland | 6,265 | 80,235 | 781 |
| 38 | 338 | Newton Abbot | South West | 3,240 | 61,343 | 528 |
| 46 | 562 | Normanton; Pontefract and Castleford | Yorkshire and the Humber | 2,820 | 78,584 | 359 |
| 6 | 205 | North Antrim | Northern Ireland | 4,940 | 76,190 | 648 |
| 37 | 555 | North Ayrshire and Arran | Scotland | 2,320 | 63,504 | 365 |
| 4 | 61 | North Cornwall | South West | 5,190 | 61,501 | 844 |
| 11 | 100 | North Devon | South West | 4,865 | 63,293 | 769 |
| 10 | 99 | North Dorset | South West | 4,940 | 63,898 | 773 |
| 14 | 527 | North Down | Northern Ireland | 2,395 | 61,435 | 390 |
| 21 | 599 | North Durham | North East | 1,945 | 60,120 | 324 |
| 22 | 200 | North East Bedfordshire | East of England | 5,230 | 80,083 | 653 |
| 45 | 318 | North East Cambridgeshire | East of England | 4,370 | 80,013 | 546 |
| 27 | 375 | North East Derbyshire | East Midlands | 3,025 | 61,561 | 491 |
| 22 | 446 | North East Fife | Scotland | 2,645 | 59,244 | 446 |
| 18 | 75 | North East Hampshire | South East | 5,500 | 67,708 | 812 |
| 13 | 124 | North East Hertfordshire | East of England | 4,895 | 67,467 | 726 |
| 26 | 198 | North East Somerset | South West | 4,145 | 63,202 | 656 |
| 4 | 33 | North Herefordshire | West Midlands | 5,630 | 59,721 | 943 |
| 30 | 236 | North Norfolk | East of England | 3,410 | 54,991 | 620 |
| 11 | 167 | North Shropshire | West Midlands | 5,090 | 74,842 | 680 |
| 12 | 114 | North Somerset | South West | 4,905 | 65,932 | 744 |
| 47 | 412 | North Swindon | South West | 3,600 | 76,679 | 469 |
| 72 | 427 | North Thanet | South East | 2,980 | 64,805 | 460 |
| 22 | 601 | North Tyneside | North East | 2,395 | 74,575 | 321 |
| 24 | 317 | North Warwickshire | West Midlands | 3,460 | 63,288 | 547 |
| 29 | 229 | North West Cambridgeshire | East of England | 5,705 | 90,967 | 627 |
| 6 | 473 | North West Durham | North East | 2,745 | 64,292 | 427 |
| 42 | 187 | North West Hampshire | South East | 4,860 | 73,162 | 664 |
| 19 | 265 | North West Leicestershire | East Midlands | 4,180 | 70,934 | 589 |
| 46 | 325 | North West Norfolk | East of England | 3,380 | 62,750 | 539 |
| 6 | 70 | North Wiltshire | South West | 5,250 | 63,664 | 825 |
| 10 | 217 | Northampton North | East Midlands | 3,735 | 58,578 | 638 |
| 22 | 279 | Northampton South | East Midlands | 4,080 | 70,595 | 578 |
| 58 | 525 | Norwich North | East of England | 2,385 | 60,821 | 392 |
| 51 | 414 | Norwich South | East of England | 3,575 | 76,326 | 468 |
| 40 | 513 | Nottingham East | East Midlands | 3,425 | 84,713 | 404 |
| 46 | 640 | Nottingham North | East Midlands | 1,670 | 66,066 | 253 |
| 36 | 492 | Nottingham South | East Midlands | 3,925 | 94,307 | 416 |
| 37 | 466 | Nuneaton | West Midlands | 2,820 | 65,006 | 434 |
| 20 | 403 | Ochil and South Perthshire | Scotland | 3,435 | 72,297 | 475 |
| 33 | 607 | Ogmore | Wales | 1,735 | 54,538 | 318 |
| 49 | 285 | Old Bexley and Sidcup | London | 3,465 | 60,370 | 574 |
| 51 | 467 | Oldham East and Saddleworth | North West | 3,105 | 71,719 | 433 |
| 59 | 509 | Oldham West and Royton | North West | 2,935 | 72,426 | 405 |
| 1 | 28 | Orkney and Shetland | Scotland | 2,945 | 30,848 | 955 |
| 30 | 162 | Orpington | London | 4,085 | 59,779 | 683 |
| 81 | 558 | Oxford East | South East | 3,280 | 90,416 | 363 |
| 50 | 246 | Oxford West and Abingdon | South East | 4,580 | 75,211 | 609 |
| 30 | 523 | Paisley and Renfrewshire North | Scotland | 2,570 | 65,397 | 393 |
| 43 | 596 | Paisley and Renfrewshire South | Scotland | 1,995 | 61,080 | 327 |
| 46 | 437 | Pendle | North West | 2,785 | 61,424 | 453 |
| 26 | 396 | Penistone and Stocksbridge | Yorkshire and the Humber | 2,855 | 59,727 | 478 |
| 2 | 15 | Penrith and The Border | North West | 5,700 | 55,297 | 1,031 |
| 16 | 324 | Perth and North Perthshire | Scotland | 3,630 | 67,189 | 540 |
| 48 | 337 | Peterborough | East of England | 4,395 | 83,146 | 529 |
| 56 | 646 | Plymouth - Moor View | South West | 1,495 | 61,868 | 242 |
| 55 | 561 | Plymouth - Sutton and Devonport | South West | 3,025 | 84,249 | 359 |
| 18 | 410 | Pontypridd | Wales | 2,690 | 57,260 | 470 |
| 25 | 195 | Poole | South West | 4,315 | 65,609 | 658 |
| 36 | 218 | Poplar and Limehouse | London | 8,220 | 128,948 | 637 |
| 67 | 384 | Portsmouth North | South East | 3,290 | 67,786 | 485 |
| 83 | 593 | Portsmouth South | South East | 2,865 | 86,759 | 330 |
| 7 | 118 | Preseli Pembrokeshire | Wales | 3,870 | 52,292 | 740 |
| 34 | 387 | Preston | North West | 3,355 | 69,379 | 484 |
| 14 | 299 | Pudsey | Yorkshire and the Humber | 3,470 | 61,612 | 563 |
| 31 | 163 | Putney | London | 5,010 | 73,428 | 682 |
| 27 | 221 | Rayleigh and Wickford | East of England | 4,285 | 67,704 | 633 |
| 48 | 208 | Reading East | South East | 5,355 | 82,805 | 647 |
| 57 | 307 | Reading West | South East | 3,885 | 70,012 | 555 |
| 25 | 612 | Redcar | North East | 1,830 | 58,644 | 312 |
| 19 | 262 | Redditch | West Midlands | 3,670 | 62,027 | 592 |
| 26 | 101 | Reigate | South East | 5,480 | 71,339 | 768 |
| 39 | 642 | Rhondda | Wales | 1,190 | 47,380 | 251 |
| 10 | 127 | Ribble Valley | North West | 4,955 | 68,513 | 723 |
| 3 | 82 | Richmond (Yorks) | Yorkshire and the Humber | 5,870 | 74,141 | 792 |
| 10 | 37 | Richmond Park | London | 8,215 | 88,093 | 933 |
| 57 | 501 | Rochdale | North West | 3,145 | 76,666 | 410 |
| 54 | 280 | Rochester and Strood | South East | 4,530 | 78,467 | 577 |
| 43 | 304 | Rochford and Southend East | East of England | 4,020 | 72,186 | 557 |
| 48 | 283 | Romford | London | 4,180 | 72,586 | 576 |
| 29 | 111 | Romsey and Southampton North | South East | 4,755 | 63,206 | 752 |
| 5 | 92 | Ross; Skye and Lochaber | Scotland | 3,730 | 47,806 | 780 |
| 35 | 392 | Rossendale and Darwen | North West | 3,270 | 68,212 | 479 |
| 37 | 483 | Rother Valley | Yorkshire and the Humber | 2,730 | 64,524 | 423 |
| 43 | 546 | Rotherham | Yorkshire and the Humber | 2,335 | 62,878 | 371 |
| 13 | 190 | Rugby | West Midlands | 4,610 | 69,665 | 662 |
| 9 | 35 | Ruislip; Northwood and Pinner | London | 6,030 | 64,297 | 938 |
| 19 | 76 | Runnymede and Weybridge | South East | 6,270 | 77,823 | 806 |
| 9 | 204 | Rushcliffe | East Midlands | 4,420 | 68,165 | 648 |
| 49 | 620 | Rutherglen and Hamilton West | Scotland | 2,285 | 74,916 | 305 |
| 5 | 108 | Rutland and Melton | East Midlands | 5,315 | 69,995 | 759 |
| 5 | 55 | Saffron Walden | East of England | 6,635 | 77,263 | 859 |
| 9 | 122 | Salford and Eccles | North West | 6,710 | 92,359 | 727 |
| 22 | 181 | Salisbury | South West | 4,300 | 64,128 | 671 |
| 13 | 284 | Scarborough and Whitby | Yorkshire and the Humber | 3,675 | 63,944 | 575 |
| 45 | 559 | Scunthorpe | Yorkshire and the Humber | 2,260 | 62,392 | 362 |
| 4 | 450 | Sedgefield | North East | 2,530 | 56,893 | 445 |
| 47 | 444 | Sefton Central | North West | 2,405 | 53,706 | 448 |
| 5 | 165 | Selby and Ainsty | Yorkshire and the Humber | 4,855 | 71,261 | 681 |
| 15 | 68 | Sevenoaks | South East | 5,285 | 63,568 | 831 |
| 52 | 630 | Sheffield - Brightside and Hillsborough | Yorkshire and the Humber | 2,075 | 74,333 | 279 |
| 36 | 476 | Sheffield - Hallam | Yorkshire and the Humber | 2,675 | 62,825 | 426 |
| 53 | 633 | Sheffield - Heeley | Yorkshire and the Humber | 1,800 | 64,907 | 277 |
| 35 | 470 | Sheffield Central | Yorkshire and the Humber | 4,800 | 112,176 | 428 |
| 31 | 430 | Sheffield South East | Yorkshire and the Humber | 2,910 | 63,721 | 457 |
| 34 | 447 | Sherwood | East Midlands | 3,065 | 68,868 | 445 |
| 20 | 356 | Shipley | Yorkshire and the Humber | 3,285 | 64,243 | 511 |
| 17 | 214 | Shrewsbury and Atcham | West Midlands | 4,715 | 73,597 | 641 |
| 70 | 420 | Sittingbourne and Sheppey | South East | 3,725 | 80,597 | 462 |
| 1 | 22 | Skipton and Ripon | Yorkshire and the Humber | 6,445 | 65,718 | 981 |
| 21 | 268 | Sleaford and North Hykeham | East Midlands | 4,585 | 78,627 | 583 |
| 51 | 247 | Slough | South East | 5,845 | 96,034 | 609 |
| 22 | 291 | Solihull | West Midlands | 3,830 | 67,366 | 569 |
| 5 | 66 | Somerton and Frome | South West | 5,900 | 70,841 | 833 |
| 11 | 361 | South Antrim | Northern Ireland | 3,575 | 70,620 | 506 |
| 50 | 366 | South Basildon and East Thurrock | East of England | 3,445 | 68,920 | 500 |
| 11 | 109 | South Cambridgeshire | East of England | 5,905 | 77,966 | 757 |
| 25 | 363 | South Derbyshire | East Midlands | 3,730 | 74,295 | 502 |
| 46 | 408 | South Dorset | South West | 2,930 | 62,335 | 470 |
| 5 | 106 | South Down | Northern Ireland | 5,840 | 76,506 | 763 |
| 12 | 119 | South East Cambridgeshire | East of England | 6,025 | 81,683 | 738 |
| 28 | 216 | South East Cornwall | South West | 3,815 | 59,774 | 638 |
| 11 | 219 | South Holland and The Deepings | East Midlands | 4,560 | 71,755 | 635 |
| 7 | 155 | South Leicestershire | East Midlands | 5,055 | 73,087 | 692 |
| 28 | 226 | South Norfolk | East of England | 4,585 | 72,990 | 628 |
| 3 | 78 | South Northamptonshire | East Midlands | 6,485 | 81,097 | 800 |
| 25 | 305 | South Ribble | North West | 3,720 | 66,844 | 557 |
| 24 | 610 | South Shields | North East | 1,830 | 58,077 | 315 |
| 23 | 297 | South Staffordshire | West Midlands | 3,720 | 65,924 | 564 |
| 15 | 152 | South Suffolk | East of England | 4,335 | 62,154 | 697 |
| 43 | 374 | South Swindon | South West | 3,765 | 76,166 | 494 |
| 66 | 380 | South Thanet | South East | 3,205 | 65,883 | 486 |
| 39 | 290 | South West Bedfordshire | East of England | 4,410 | 77,534 | 569 |
| 41 | 365 | South West Devon | South West | 2,940 | 58,777 | 500 |
| 3 | 39 | South West Hertfordshire | East of England | 6,855 | 73,743 | 930 |
| 44 | 312 | South West Norfolk | East of England | 3,930 | 71,333 | 551 |
| 3 | 13 | South West Surrey | South East | 7,155 | 69,195 | 1,034 |
| 34 | 274 | South West Wiltshire | South West | 3,970 | 68,326 | 581 |
| 59 | 321 | Southampton - Itchen | South East | 4,265 | 78,291 | 545 |
| 78 | 516 | Southampton - Test | South East | 3,275 | 81,755 | 401 |
| 33 | 249 | Southend West | East of England | 3,725 | 61,741 | 603 |
| 33 | 382 | Southport | North West | 2,920 | 60,103 | 486 |
| 40 | 156 | Spelthorne | South East | 4,645 | 67,191 | 691 |
| 2 | 26 | St Albans | East of England | 6,725 | 69,935 | 962 |
| 36 | 315 | St Austell and Newquay | South West | 3,930 | 71,538 | 549 |
| 66 | 551 | St Helens North | North West | 2,485 | 67,466 | 368 |
| 65 | 547 | St Helens South and Whiston | North West | 2,610 | 70,356 | 371 |
| 23 | 183 | St Ives | South West | 3,810 | 57,143 | 667 |
| 27 | 362 | Stafford | West Midlands | 3,410 | 67,749 | 503 |
| 16 | 211 | Staffordshire Moorlands | West Midlands | 3,385 | 52,674 | 643 |
| 56 | 494 | Stalybridge and Hyde | North West | 2,685 | 64,789 | 414 |
| 41 | 296 | Stevenage | East of England | 3,805 | 67,305 | 565 |
| 15 | 273 | Stirling | Scotland | 3,870 | 66,568 | 581 |
| 21 | 294 | Stockport | North West | 3,545 | 62,479 | 567 |
| 11 | 532 | Stockton North | North East | 2,415 | 62,636 | 386 |
| 9 | 498 | Stockton South | North East | 2,945 | 71,389 | 413 |
| 47 | 548 | Stoke-on-Trent Central | West Midlands | 2,285 | 61,623 | 371 |
| 52 | 587 | Stoke-on-Trent North | West Midlands | 2,260 | 67,012 | 337 |
| 55 | 604 | Stoke-on-Trent South | West Midlands | 1,915 | 60,056 | 319 |
| 10 | 159 | Stone | West Midlands | 3,995 | 57,996 | 689 |
| 32 | 433 | Stourbridge | West Midlands | 2,770 | 60,843 | 455 |
| 10 | 351 | Strangford | Northern Ireland | 3,245 | 62,878 | 516 |
| 3 | 14 | Stratford-on-Avon | West Midlands | 6,410 | 62,111 | 1,032 |
| 69 | 418 | Streatham | London | 4,405 | 95,027 | 464 |
| 28 | 341 | Stretford and Urmston | North West | 3,640 | 69,236 | 526 |
| 14 | 123 | Stroud | South West | 5,220 | 71,877 | 726 |
| 14 | 150 | Suffolk Coastal | East of England | 4,640 | 66,269 | 700 |
| 16 | 574 | Sunderland Central | North East | 2,495 | 71,985 | 347 |
| 37 | 142 | Surrey Heath | South East | 5,200 | 73,670 | 706 |
| 34 | 174 | Sutton and Cheam | London | 4,745 | 70,208 | 676 |
| 18 | 239 | Sutton Coldfield | West Midlands | 3,805 | 61,488 | 619 |
| 35 | 618 | Swansea East | Wales | 1,800 | 58,595 | 307 |
| 27 | 563 | Swansea West | Wales | 2,155 | 60,748 | 355 |
| 25 | 322 | Tamworth | West Midlands | 3,540 | 65,022 | 544 |
| 1 | 10 | Tatton | North West | 6,105 | 56,569 | 1,079 |
| 24 | 186 | Taunton Deane | South West | 5,265 | 79,217 | 665 |
| 31 | 421 | Telford | West Midlands | 3,115 | 67,404 | 462 |
| 30 | 228 | Tewkesbury | South West | 4,595 | 73,257 | 627 |
| 1 | 20 | The Cotswolds | South West | 6,775 | 67,724 | 1,000 |
| 36 | 454 | The Wrekin | West Midlands | 2,920 | 66,334 | 440 |
| 2 | 36 | Thirsk and Malton | Yorkshire and the Humber | 6,295 | 67,369 | 934 |
| 20 | 175 | Thornbury and Yate | South West | 3,920 | 58,088 | 675 |
| 42 | 298 | Thurrock | East of England | 5,055 | 89,739 | 563 |
| 7 | 73 | Tiverton and Honiton | South West | 5,425 | 66,507 | 816 |
| 24 | 97 | Tonbridge and Malling | South East | 5,525 | 71,380 | 774 |
| 44 | 243 | Tooting | London | 5,085 | 82,475 | 617 |
| 49 | 456 | Torbay | South West | 2,880 | 65,730 | 438 |
| 31 | 583 | Torfaen | Wales | 1,940 | 57,247 | 339 |
| 9 | 87 | Torridge and West Devon | South West | 5,265 | 66,784 | 788 |
| 8 | 84 | Totnes | South West | 4,395 | 55,523 | 792 |
| 55 | 334 | Tottenham | London | 5,485 | 103,598 | 529 |
| 17 | 137 | Truro and Falmouth | South West | 4,685 | 65,839 | 712 |
| 22 | 89 | Tunbridge Wells | South East | 5,660 | 72,407 | 782 |
| 11 | 48 | Twickenham | London | 7,375 | 81,279 | 907 |
| 7 | 496 | Tynemouth | North East | 2,805 | 67,968 | 413 |
| 12 | 472 | Upper Bann | Northern Ireland | 3,705 | 86,735 | 427 |
| 43 | 241 | Uxbridge and South Ruislip | London | 4,900 | 79,343 | 618 |
| 14 | 352 | Vale of Clwyd | Wales | 2,445 | 47,477 | 515 |
| 21 | 438 | Vale of Glamorgan | Wales | 3,165 | 69,946 | 452 |
| 37 | 225 | Vauxhall | London | 6,325 | 100,412 | 630 |
| 23 | 359 | Wakefield | Yorkshire and the Humber | 3,515 | 69,257 | 508 |
| 72 | 602 | Wallasey | North West | 1,965 | 61,482 | 320 |
| 54 | 592 | Walsall North | West Midlands | 2,220 | 67,052 | 331 |
| 40 | 488 | Walsall South | West Midlands | 2,990 | 71,080 | 421 |
| 47 | 267 | Walthamstow | London | 4,995 | 85,007 | 588 |
| 15 | 572 | Wansbeck | North East | 1,960 | 56,415 | 347 |
| 44 | 191 | Wantage | South East | 5,440 | 82,307 | 661 |
| 43 | 528 | Warley | West Midlands | 2,595 | 66,798 | 388 |
| 38 | 399 | Warrington North | North West | 3,180 | 66,801 | 476 |
| 6 | 88 | Warrington South | North West | 6,015 | 76,777 | 783 |
| 9 | 144 | Warwick and Leamington | West Midlands | 5,130 | 72,890 | 704 |
| 28 | 634 | Washington and Sunderland West | North East | 1,640 | 60,199 | 272 |
| 10 | 104 | Watford | East of England | 6,405 | 83,757 | 765 |
| 52 | 419 | Waveney | East of England | 3,140 | 67,794 | 463 |
| 16 | 72 | Wealden | South East | 5,885 | 71,894 | 819 |
| 24 | 303 | Weaver Vale | North West | 3,440 | 61,705 | 557 |
| 2 | 30 | Wellingborough | East Midlands | 7,235 | 76,054 | 951 |
| 15 | 130 | Wells | South West | 5,045 | 70,055 | 720 |
| 37 | 270 | Welwyn Hatfield | East of England | 4,835 | 83,050 | 582 |
| 39 | 524 | Wentworth and Dearne | Yorkshire and the Humber | 2,645 | 67,356 | 393 |
| 3 | 83 | West Aberdeenshire and Kincardine | Scotland | 5,265 | 66,510 | 792 |
| 44 | 536 | West Bromwich East | West Midlands | 2,395 | 62,826 | 381 |
| 39 | 485 | West Bromwich West | West Midlands | 2,765 | 65,446 | 422 |
| 3 | 60 | West Dorset | South West | 5,310 | 62,910 | 844 |
| 50 | 621 | West Dunbartonshire | Scotland | 1,890 | 62,560 | 302 |
| 67 | 395 | West Ham | London | 6,810 | 142,201 | 479 |
| 26 | 323 | West Lancashire | North West | 3,595 | 66,389 | 542 |
| 34 | 254 | West Suffolk | East of England | 4,775 | 79,918 | 597 |
| 2 | 46 | West Tyrone | Northern Ireland | 5,780 | 63,388 | 912 |
| 7 | 47 | West Worcestershire | West Midlands | 5,680 | 62,414 | 910 |
| 42 | 234 | Westminster North | London | 6,145 | 98,696 | 623 |
| 4 | 41 | Westmorland and Lonsdale | North West | 5,135 | 55,722 | 922 |
| 40 | 355 | Weston-Super-Mare | South West | 3,790 | 74,045 | 512 |
| 53 | 480 | Wigan | North West | 3,080 | 72,706 | 424 |
| 7 | 17 | Wimbledon | London | 7,115 | 70,223 | 1,013 |
| 28 | 110 | Winchester | South East | 5,100 | 67,465 | 756 |
| 10 | 45 | Windsor | South East | 6,630 | 72,569 | 914 |
| 39 | 404 | Wirral South | North West | 2,265 | 47,713 | 475 |
| 42 | 423 | Wirral West | North West | 2,075 | 44,915 | 462 |
| 18 | 166 | Witham | East of England | 4,235 | 62,180 | 681 |
| 27 | 103 | Witney | South East | 5,635 | 73,512 | 767 |
| 23 | 94 | Woking | South East | 5,605 | 72,211 | 776 |
| 25 | 98 | Wokingham | South East | 5,920 | 76,503 | 774 |
| 56 | 609 | Wolverhampton North East | West Midlands | 1,955 | 61,713 | 317 |
| 38 | 471 | Wolverhampton South East | West Midlands | 2,700 | 63,106 | 428 |
| 30 | 407 | Wolverhampton South West | West Midlands | 2,855 | 60,527 | 472 |
| 35 | 453 | Worcester | West Midlands | 3,125 | 70,825 | 441 |
| 18 | 261 | Workington | North West | 3,175 | 53,656 | 592 |
| 58 | 507 | Worsley and Eccles South | North West | 2,835 | 69,856 | 406 |
| 62 | 330 | Worthing West | South East | 3,390 | 63,241 | 536 |
| 20 | 432 | Wrexham | Wales | 2,195 | 48,203 | 455 |
| 19 | 161 | Wycombe | South West | 5,130 | 75,053 | 684 |
| 13 | 171 | Wyre and Preston North | North West | 4,050 | 59,812 | 677 |
| 14 | 192 | Wyre Forest | West Midlands | 4,395 | 66,564 | 660 |
| 61 | 518 | Wythenshawe and Sale East | North West | 2,945 | 73,647 | 400 |
| 39 | 344 | Yeovil | South West | 3,845 | 73,312 | 524 |
| 12 | 309 | Ynys Môn | Wales | 2,525 | 45,638 | 553 |
| 44 | 553 | York Central | Yorkshire and the Humber | 3,160 | 86,424 | 366 |
| 11 | 250 | York Outer | Yorkshire and the Humber | 3,890 | 64,568 | 602 |